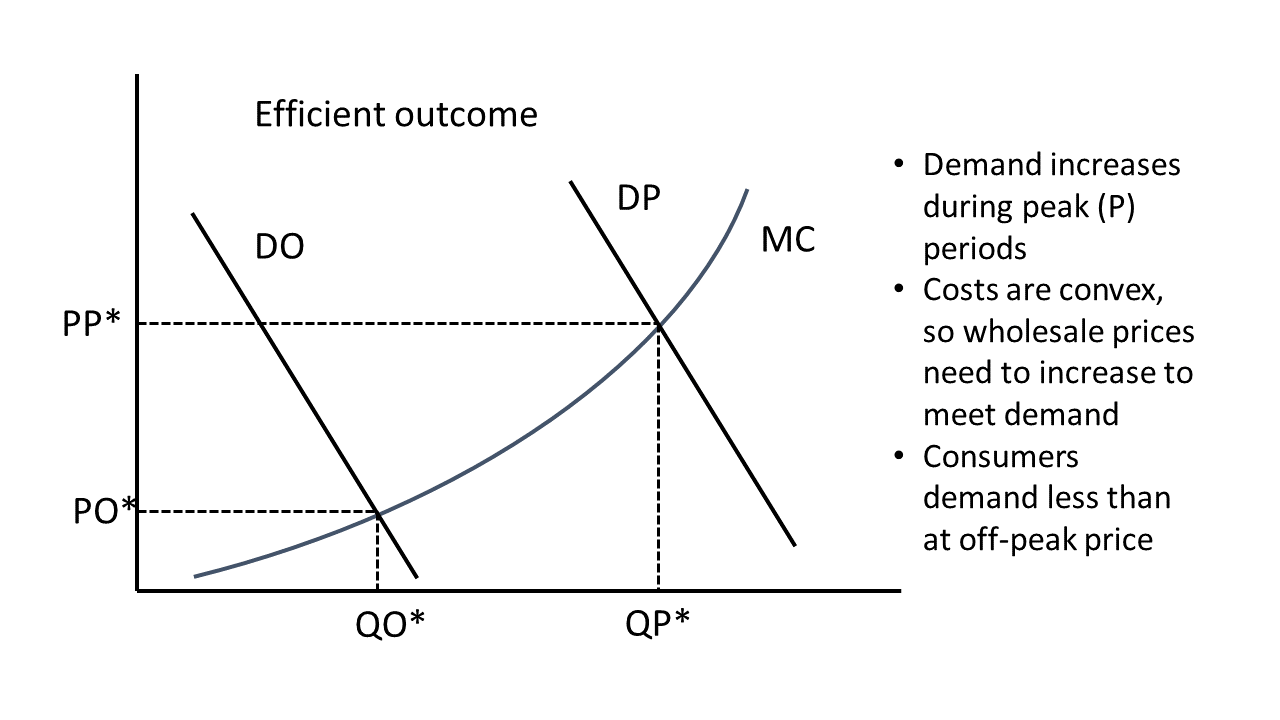
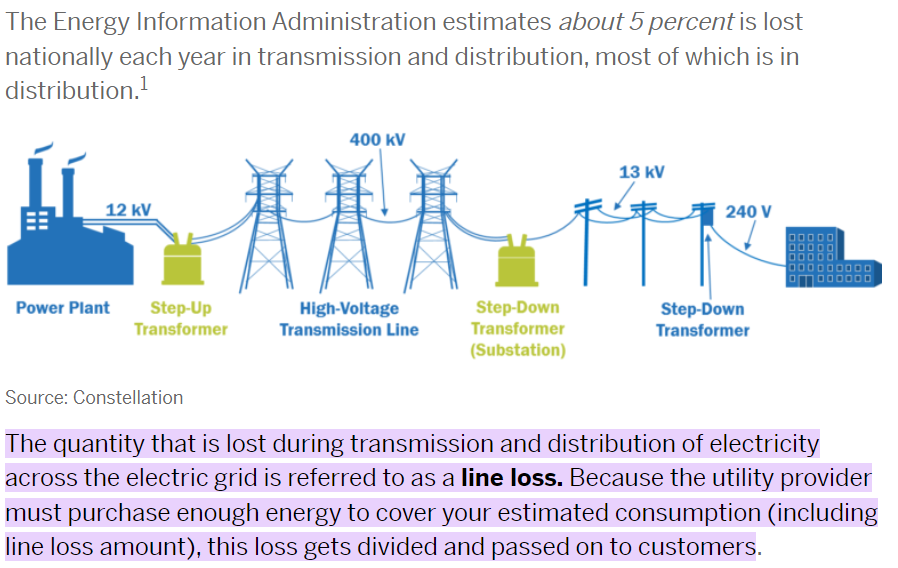
How it should work
![]()
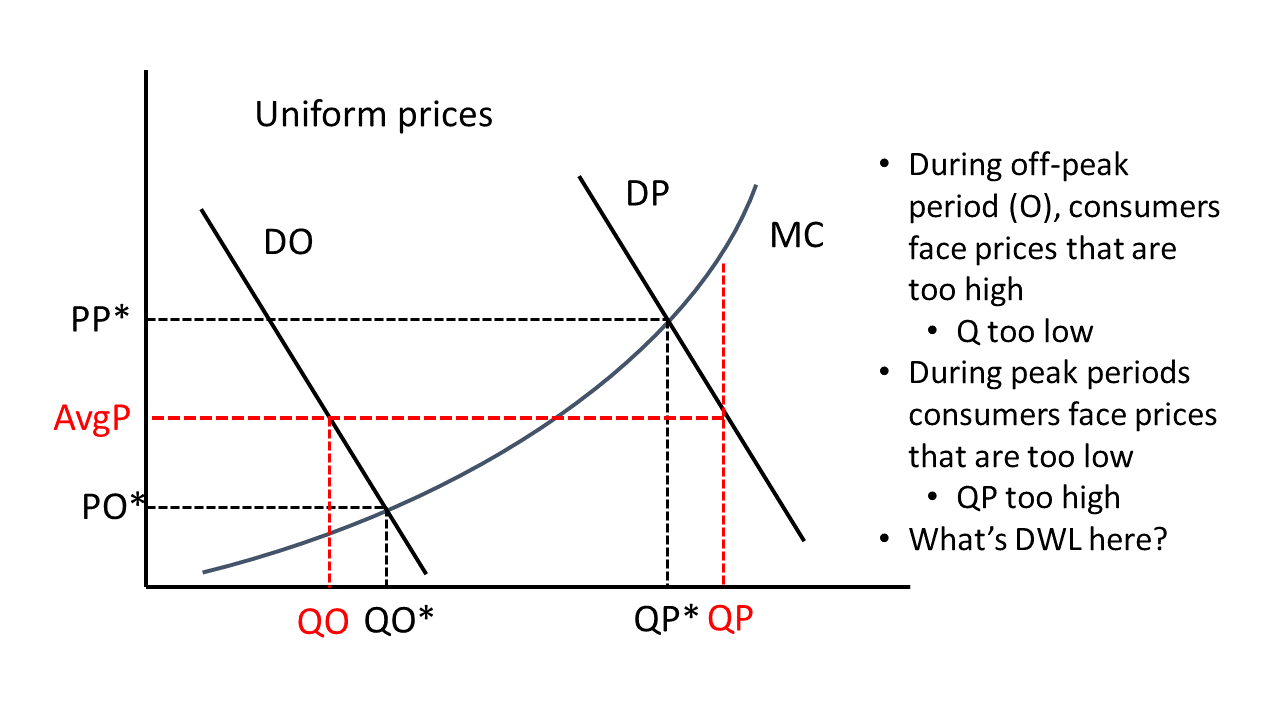
Problem: Most people face a single price
I pay the same price per unit regardless of when I use it.
This is economically inefficient
![]()
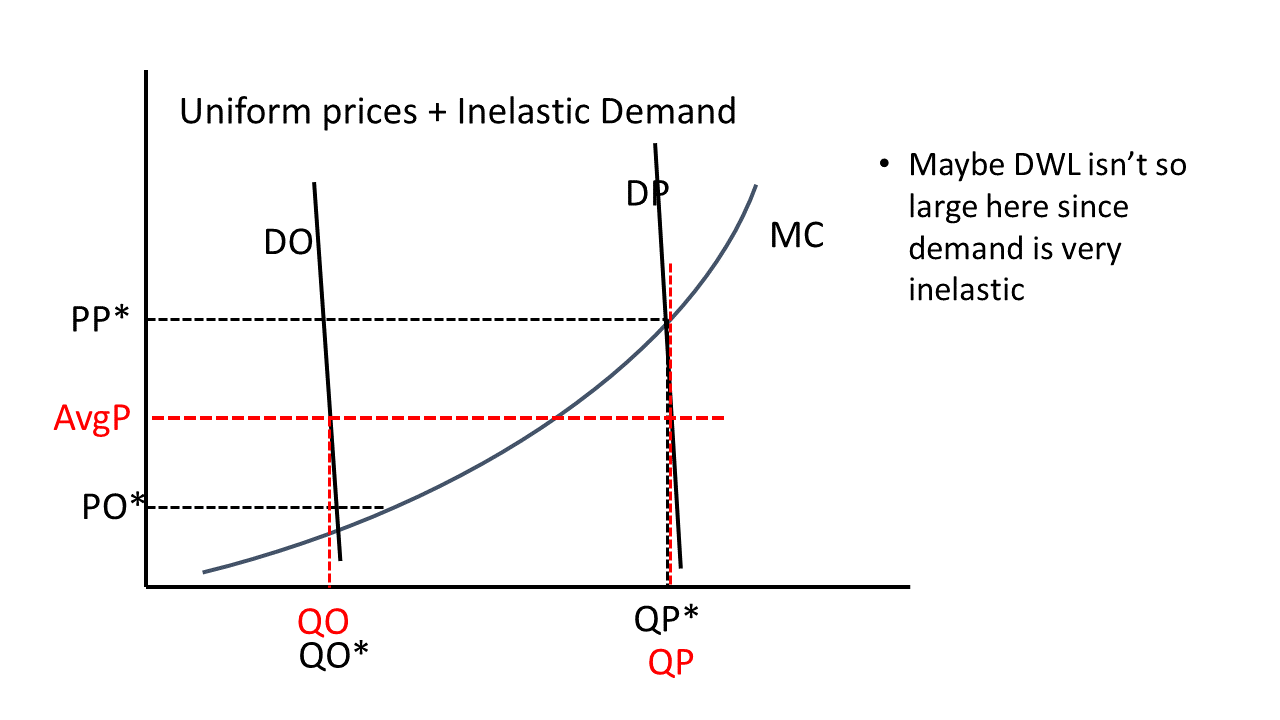
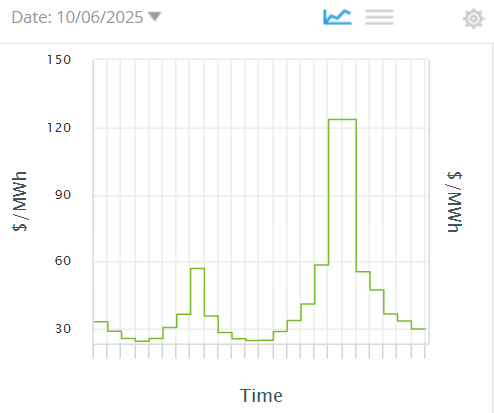
Reminder: Consumption at peak hours is very costly
- some plants only operate a few hours
- if consumers faced these costs during those hours, could we avoid needing some of these “peaker” plants?
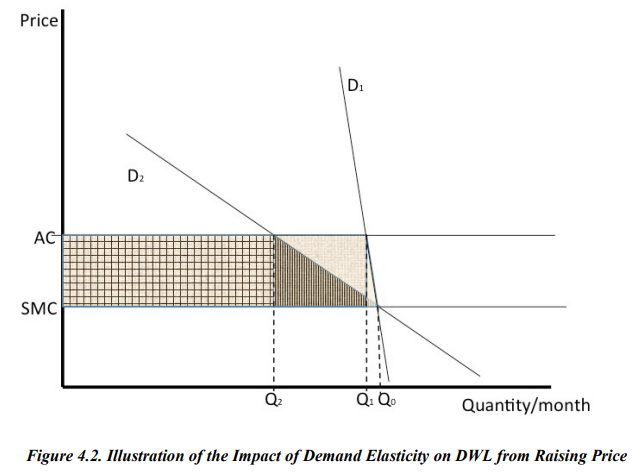
- answer depends on how elastic demand really is
If D inelastic, avg price won’t distort Q much
![]()
Are consumers really that inelastic?
- Most consumers face a flat price (no sure how responsive they are)
- Some utilities charge higher prices during peak-pricing events … But even then, people don’t change their behavior much
- Is this people’s true preference?
- Think of when you lived off campus? Did you know how much electricity you used?
- If you got a big bill, would you know what to change?
Hypothesis: People are not even aware of how much they use
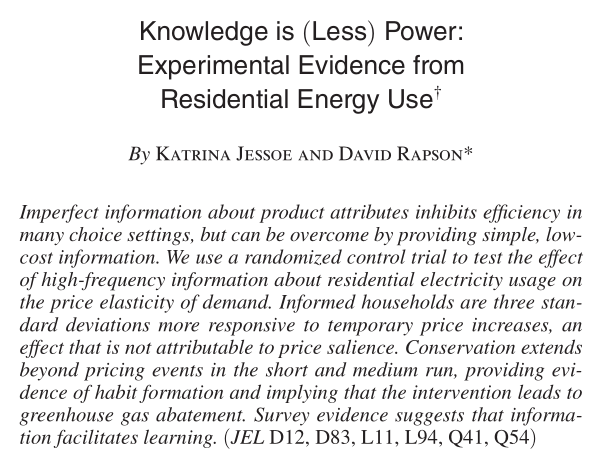
Jessoe and Rapson (2014)
![]()
What is the research question in this paper?
- How much will people conserve if we impose higher prices during peak events?
- Will they respond more if they have real-time information on their electricity use?
Experimental setup
How do the authors go about testing whether people will conserve more if they have more information on their electricity use?
Why is an experiment necessary?
- Real time monitors are available on Amazon
- Could get data on consumers who do and don’t have them installed, and compare their responses to peak price events
- What is the problem with this approach?
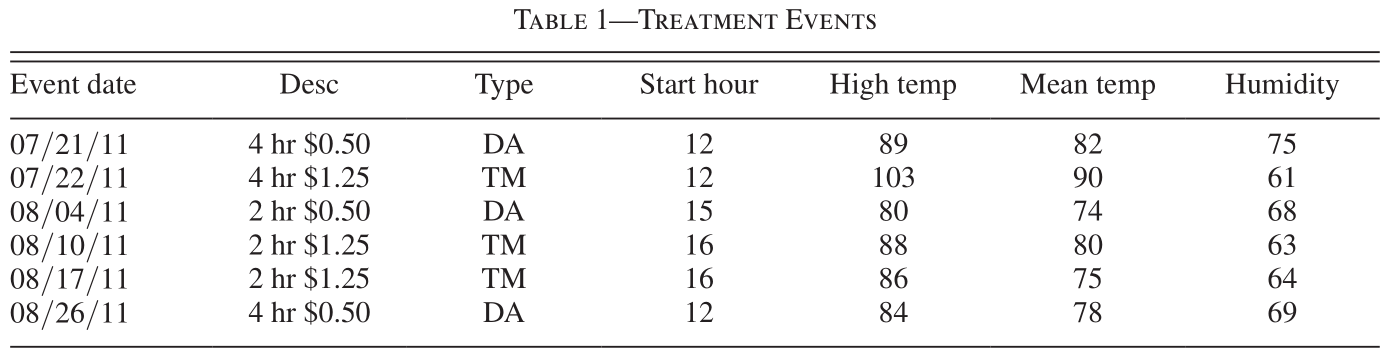
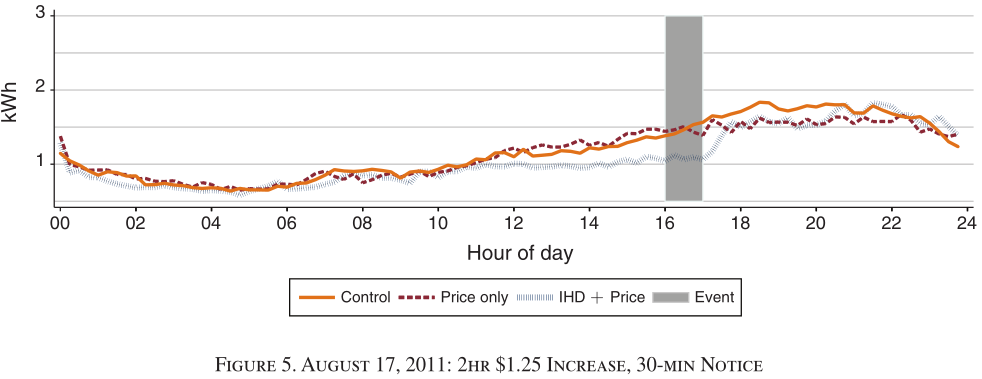
Here are the pricing events
![]()
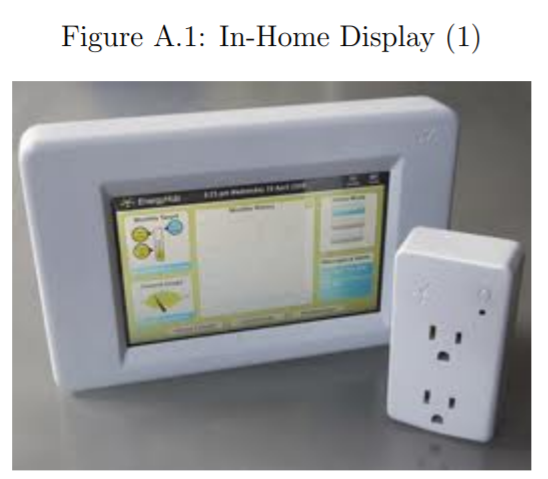
What does the display really tell users?
![]()
Customers view in real time the quantity of power being consumed, the price of electricity, and their estimated monthly bill-to-date.
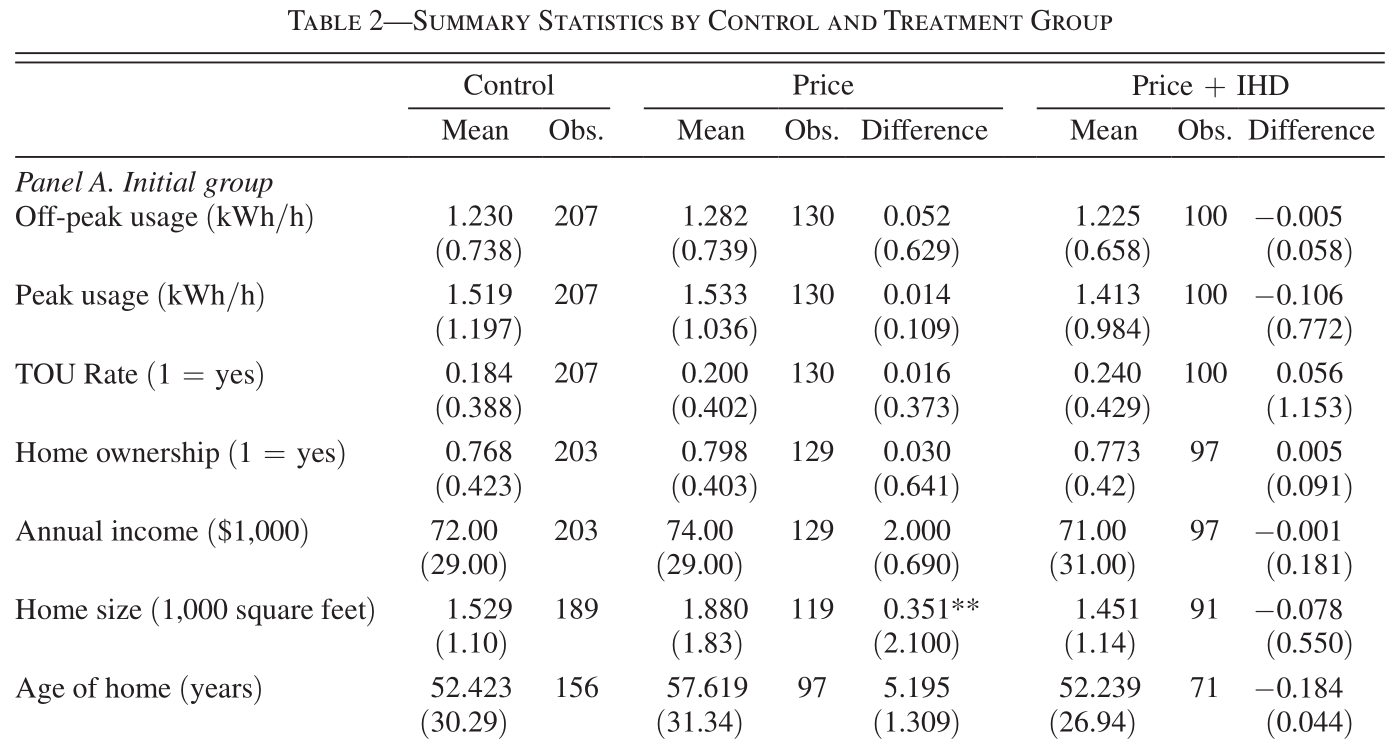
What do we learn relative to the price only group?
Since treatment groups randomly assigned, can see they are the same
![]()
We know this isn’t all the \(X\)’s that matter, but if these are “balanced”, we infer that randomization worked.
[Note this paper also has some attrition that they have to deal with.]
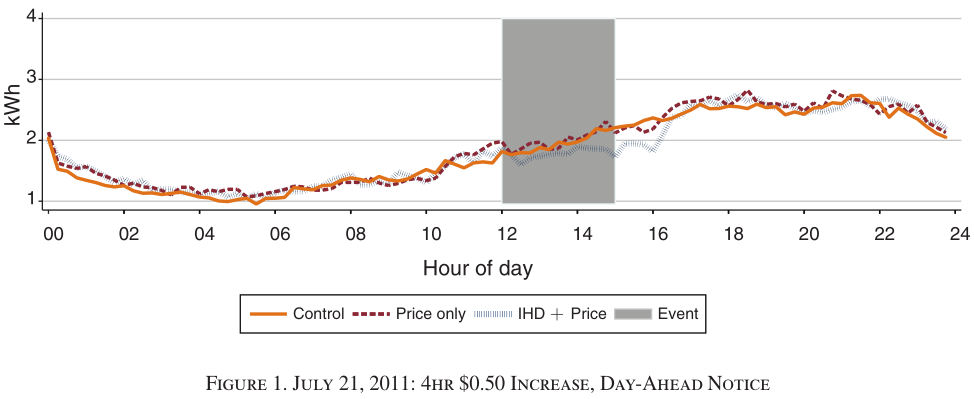
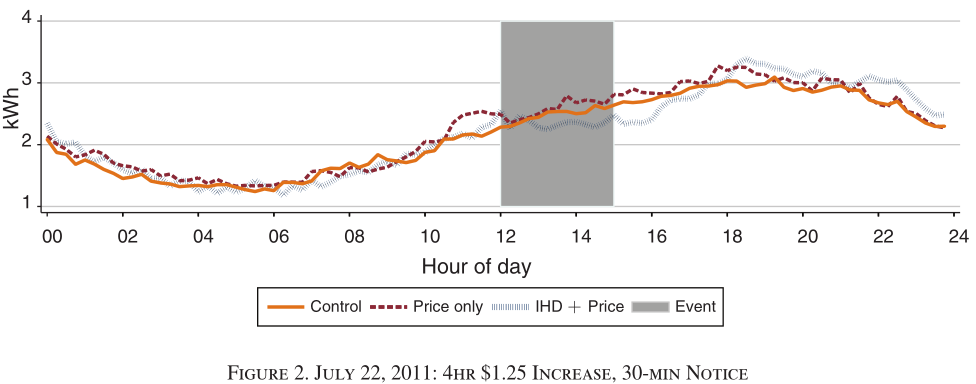
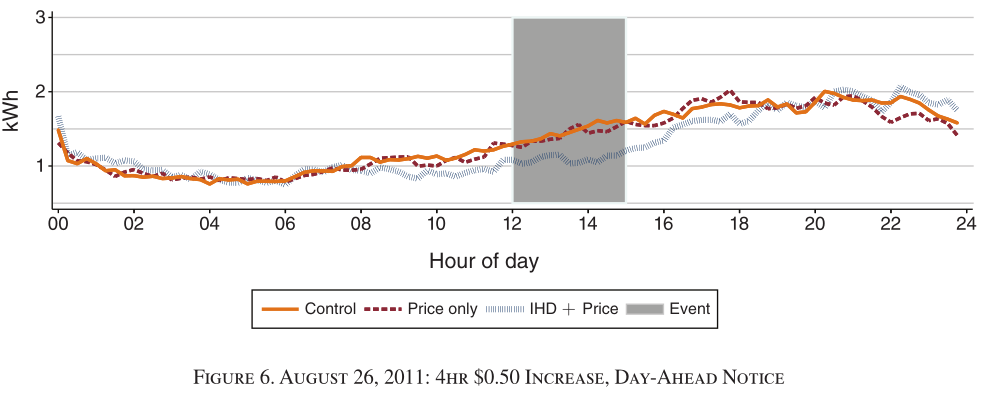
JR compare usage across groups on event days
![]()
Largest effects were on day 5 and 6
![]()
What might be going on there?
![]()
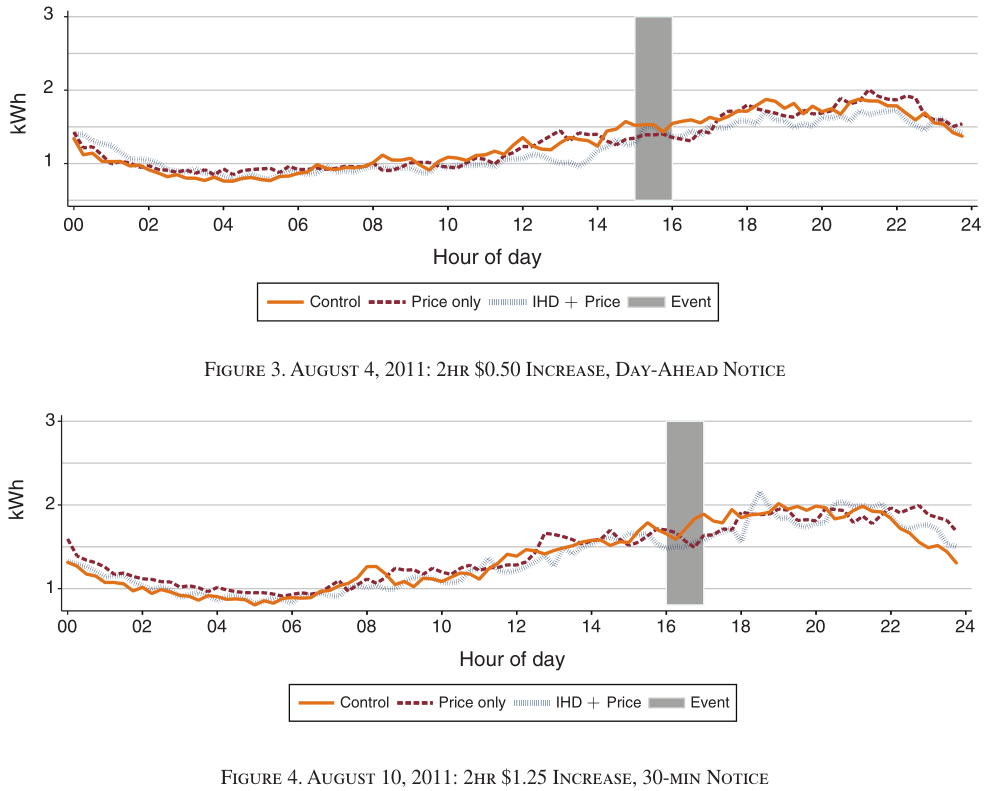
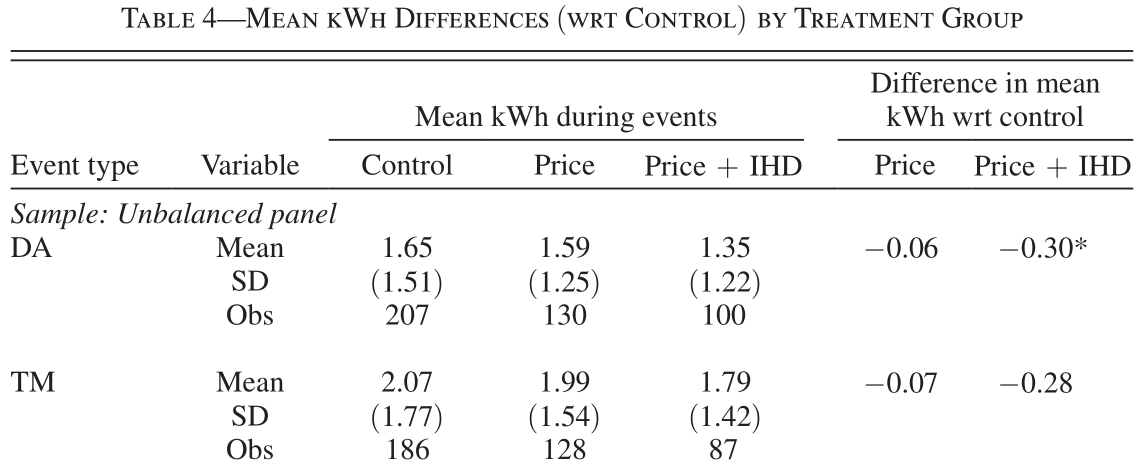
With an RCT, can just compare means
![]()
- Price-only group usage declines by 0 to 7 percent.
- IHD group usage declines by 8 to 22 percent.
Having established a difference, authors then explore the mechanism
- Doesn’t seem to be “salience” (ie people just more aware an event is happening)
- People seem to plan more for day ahead event (usage changes in hours before / after)
- Some evidence of habit formation. A result they emphasize is that usage declines in non-event hours more among this group as well.
Four Fundamental Goals of Rate Design
(from Severin Borenstein)
- Economic Efficiency of Consumption: encouraging additional usage when – and only when – it is valued more than the full additional cost to society
- Cost Recovery: allowing suppliers to recover costs, including the opportunity cost of capital
- Equity: distributing costs among customers in a way that is consistent with societal views of fairness
- Ensuring Access: ensure that everyone is able to consume quantities necessary for basic needs
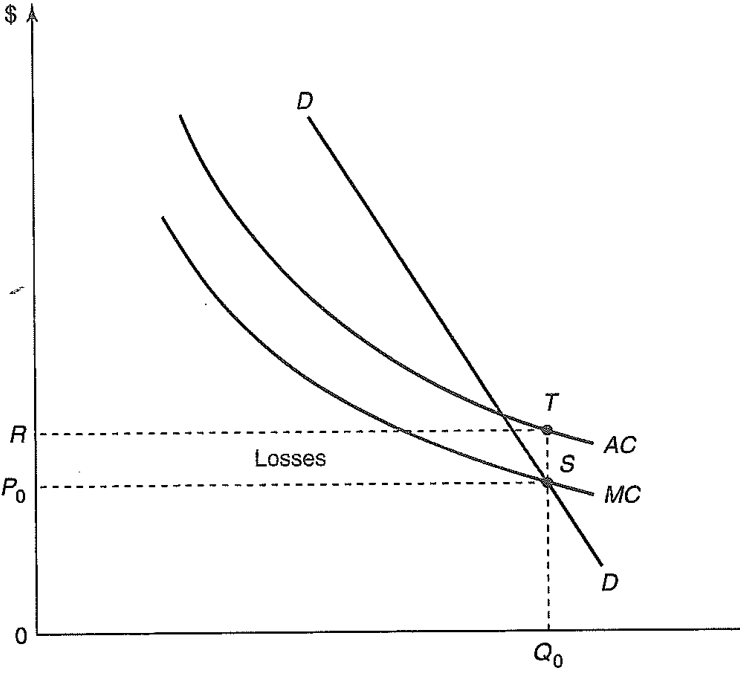
Traditional Utility Regulation
Industry thought to be a natural monopoly
What makes a natural monopoly?
- Declining long run average costs (LRAC)
- the more you produce, the lower your average cost
- What generates this?
- Large fixed costs
- Economies of scale
- Implication: (theoretically) cheaper to produce with a single firm
How to fix the monopoly pricing problem?
- Natural monopoly: a single firm can produce cheaper than many firms
- However, a single firm also has the ability to exert market power, undermining these cost efficiencies
How should the government balance the cost savings and market power concerns?
- One option is to have the government simply run operations
In US electricity, a “regulation” system was preferred
- Regulation typically done at the state level.
- Monopoly utilities would make investments in generation and supply power
- The regulator would set price they could charge such that they earned a “fair” return on these investments
Goals for the electric power system
- Keep the lights on! (avoid blackouts)
- At the lowest possible cost (or price?)
Traditional rate-of-return regulation:
The regulator allows firm to collect just enough money:
- cover “prudent” costs
- earn a “fair” return invested capital
\(\text{Revenue Requirement} = \text{O&M} + \text{Energy} + r \times \text{Rate Base}\)
- operations & maintenance (labor, trucks, repairs)
- Fuel = cost of energy inputs (ie wholesale purchases)
- Rate Base = undepreciated capital invested
- \(r\) = allowed rate of return (set by regulator)
The “rate case”
What the utility brings to the regulator:
- Its Regulatory Asset Base (“rate base”): poles, wires, substations, meters, transformers, etc.
- Its expected O&M: salaries for lineworkers, truck fleets, tree trimming, call centers.
- Its expected purchased power costs.
- A proposed “reasonable” rate of return (r) on capital.
The “rate case” (.cont)
What the regulator decides:
- Which costs are “prudently incurred.”
- Which assets are “used and useful.”
- What the allowed (r) should be (often tied to the utility’s cost of capital).
Output of the rate case:
An approved Revenue Requirement for the year.
From Tariff Design to Customer Bills
- Turn Revenue Requirement into specific charges:
- fixed monthly charge,
- ¢/kWh usage charge,
- Customers are billed using that tariff.
- Actual dollars collected from customers = actual usage × approved rates.
- If actual ≠ forecast, rates adjusted next time.
- Implication: utility essentially guaranteed to recover approved return on investment. (no more, no less)
What are some concerns with this system?
(ie why does utility regulation “suck”?)
- 1. Provides no incentive to minimize operating costs
- 2. Biases firms towards accumulating capital
How profit works for an unregulated firm
- Sets price to maximize profit
\(\pi = P(Q)\cdot Q - C(Q)\)
- Keeps all gains from lowering cost.
Incentive:
- Automate / Streamline
- Lean staffing / cheaper inputs
- Constant pressure to minimize total cost
→ Lower cost → higher profit per unit.
In contrast, a regulated utility has no incentive to be efficient
\[\text{Revenue Requirement} = \text{O&M} + \text{Energy} + r \times \text{Rate Base}\]
- Under regulation, price is guaranteed to cover costs.
- If they do a bad job, consumers foot the bill.
- If they do a good job, regulator takes the savings and gives it to customers.
- This gives regulated firms no incentive to reduce costs
Example: maintenance vs. upgrade
- Option A: keep old wooden poles
- Annual maintenance crew cost: $10M/year (O&M).
- Option B: replace with new composite poles & hardware
- One-time capital spend: $200M.
- Maintenance falls to $3M/year for 20 years.
- That $200M goes into the rate base.
- If allowed return r = 8%:
- The annual revenue requirement goes up by ~$11 million per year!
- ($18M increase minus $7M O&M decrease)
- Utility earns money on B but not A.
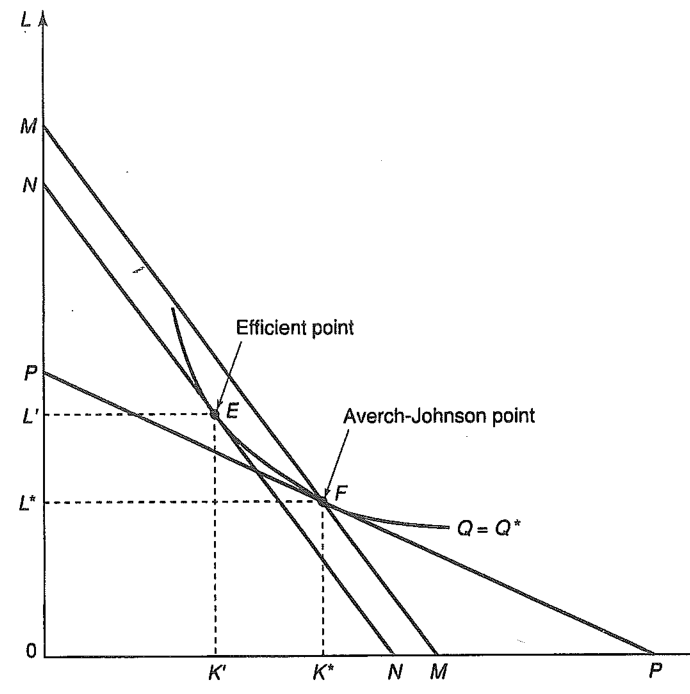
Capital Bias (Theory) - Averch–Johnson effect
In a normal market, inputs are selected to minimize the cost of achieving any output
- Revenue produced by combining capital and labor \[\pi=R(K,L)-wL-rK\]
- Ratio of first order condition for both inputs yields: \[\frac{\partial R/\partial K}{\partial R/\partial L}=\frac{r}{w}\]
- Inputs are selected such that the ratio of marginal products is equal to the ratio of marginal costs
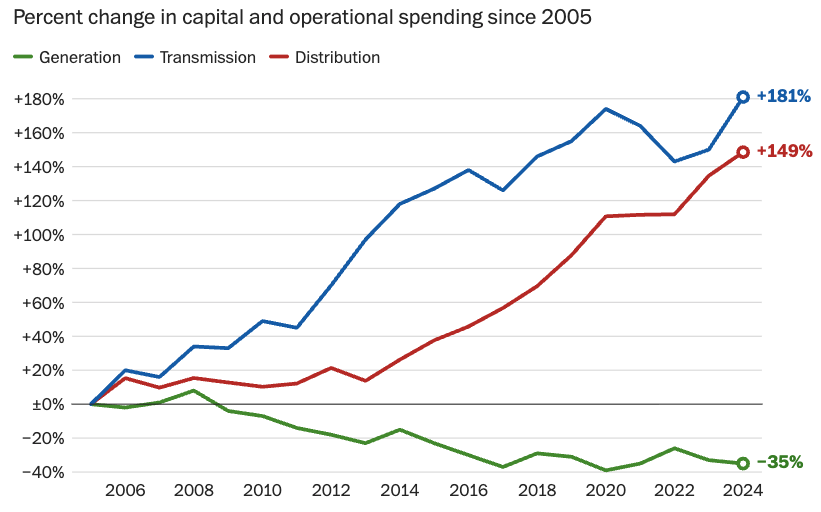
The Averch-Johnson Effect
![]()
Source: VHV ch 12
Regulation Summary
- Electric power historically run as vertically integrated regulated monopoly.
- The primary objective of this system was to keep the lights on, and it did that quite well.
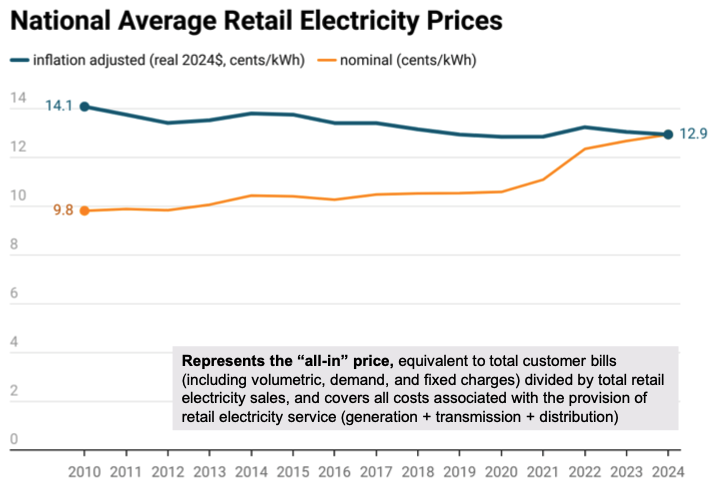
- But perverse incentives distorted behavior:
- Because costs were covered, the utility had no incentive to operation efficiently.
- Because returns were tied to capital expenditures, utilities were distorted towards building large expensive plants.
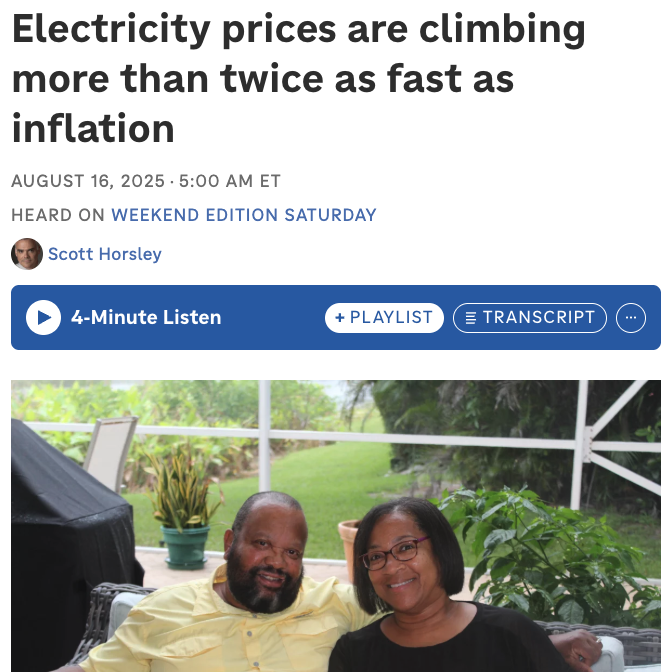
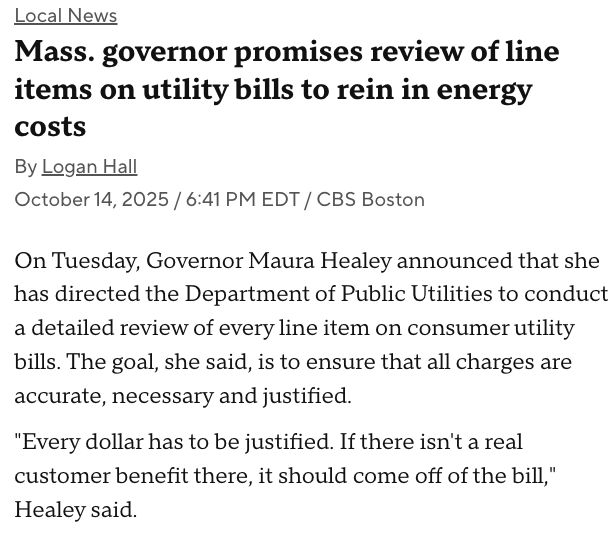
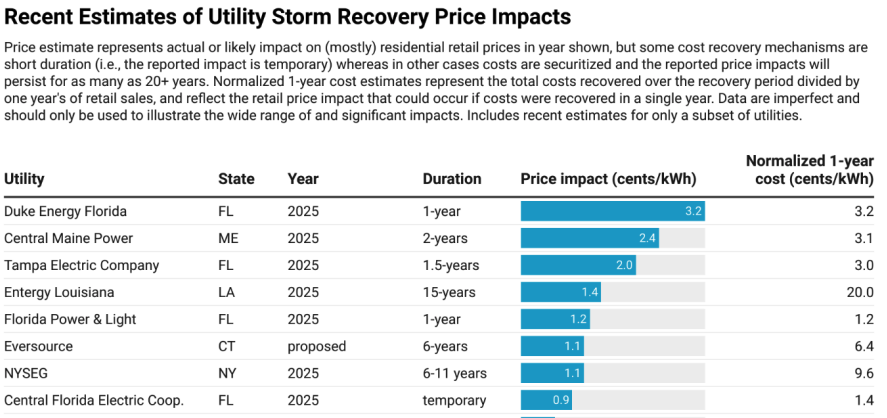
Recent trends bringing issues back to forefront
- The energy transition will require a lot of investment
- Smart grid, renewables, storage, EV infrastructure, etc.
- How do we know what’s really needed and where?
- Extreme weather events destroys infrastructure
- Utilities want to rebuild stronger. Is it worth it?
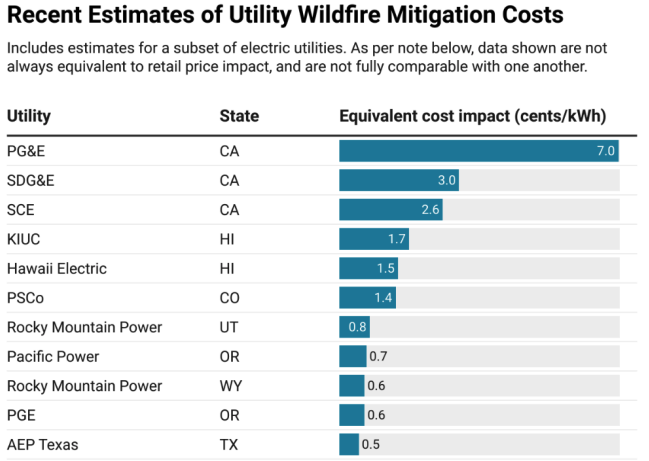
- Wildfire mitigation is essential
- Should we put lines underground? Or trim trees?
- AI boom…
- See this LBL report for details
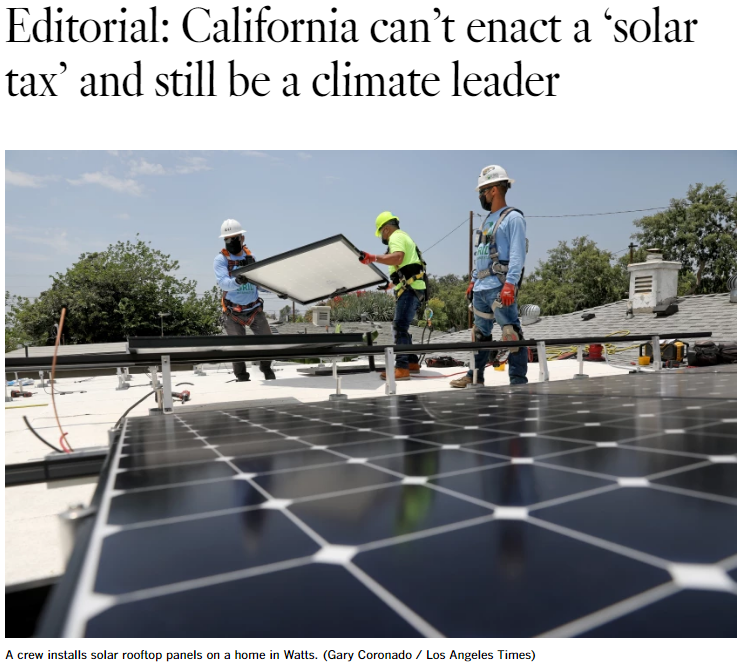
Distributed Solar Power and Retail Pricing
What happens when consumers can produce their own electricity?
- To combat climate change, need to transition to renewables asap
- Solar will probably be the dominant source of electrictiy generation in the future
- A large share of this solar is actually distributed on rooftops of homes and businesses
- This decision depends on utility rates and also affects utility rates going forward.
Grid scale vs distributed solar
What are some pros and cons of distributed relative to grid scale?
Pros of distributed generation
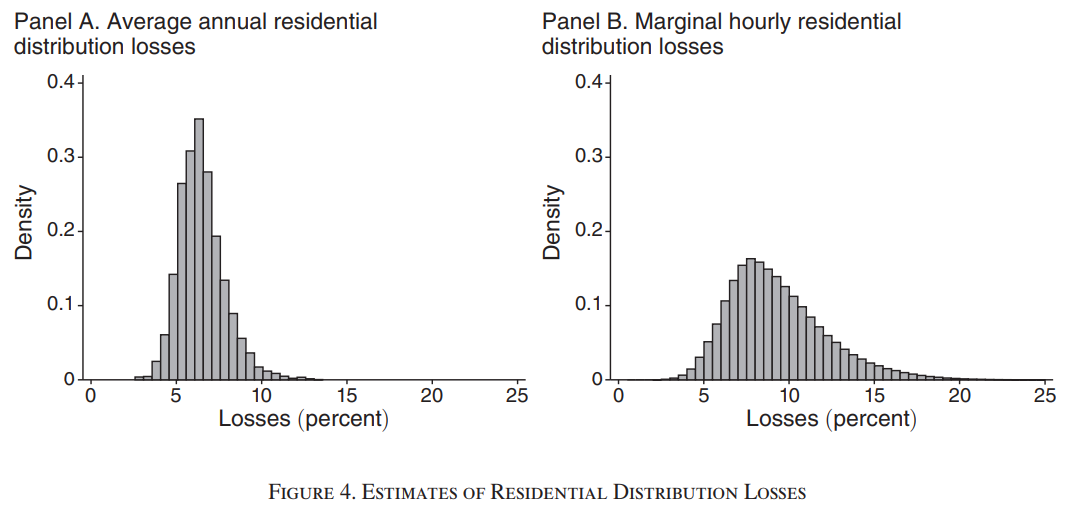
- No line losses (7-9%)
- Cheap real estate
- your roof is unused space anyways (may even provide shade)
- May reduce need for new transmission /distribution lines
- Spreading panels around reduces ‘risk’ of clouds
- “Freedom” / independence from the grid etc
- strange coalition of environmentalists and anti-government types has emerged to support PV
Source: Severin Borenstein
Cons of distributed generation
- Design and maintenance is MUCH more expensive
- Lose all economies of scale
- GS panels often move throughout the day to track sun
- DG installed where consumers choose, not grid operators
- Also a lot of controversy over the true cost of DG and how it should be promoted
Source: Severin Borenstein
Where should we put solar?
If you were a social planner, where would you put solar panels? and Why?
- Sunny places (low LCOE)
- High demand places (high value)
- Places with lots of polluting plants
Where will solar actually be installed if it’s up to individual consumers?
What factors will make some consumers more likely to install solar panels than others?
- High (marginal) electricity prices
- Subsidies
- Environmental preferences
The private economics of solar PV adoption
- Consumers have utility from electricity consumption \[U=\sum_{h}(u_{h}-p_{h})e_{h}\]
- \(u\),\(p\),\(e\) represent utility and electricity consumption in hour \(h\)
- most consumers face a flat price for electricity (\(p=p\))
Installing solar panels reduces the need to buy electricity from the grid by the output of the panels (\(s\)).
\[U_{s}=\sum_{h}(u_{h}e_{h})-\sum_{h}p(e_h - s_h) +\omega-F\]
- \(\omega\) represents the “green glow” of going solar and \(F\) is the fixed cost of the installation.
- Ignore discounting for now.
- Then it makes sense to adopt if: \(\sum s_{h}p+\omega>F\)
Who adopts in this model?
Adopt if, \(\sum s_{h}p+\omega>F\)
- consumers with high \(p\) and \(s\)
- if can’t sell back, consumers with high usage too
- “environmentally conscious” consumers (high \(\omega\) )
- consumers that face low fixed costs (\(F\))
- possibly due to subsidies
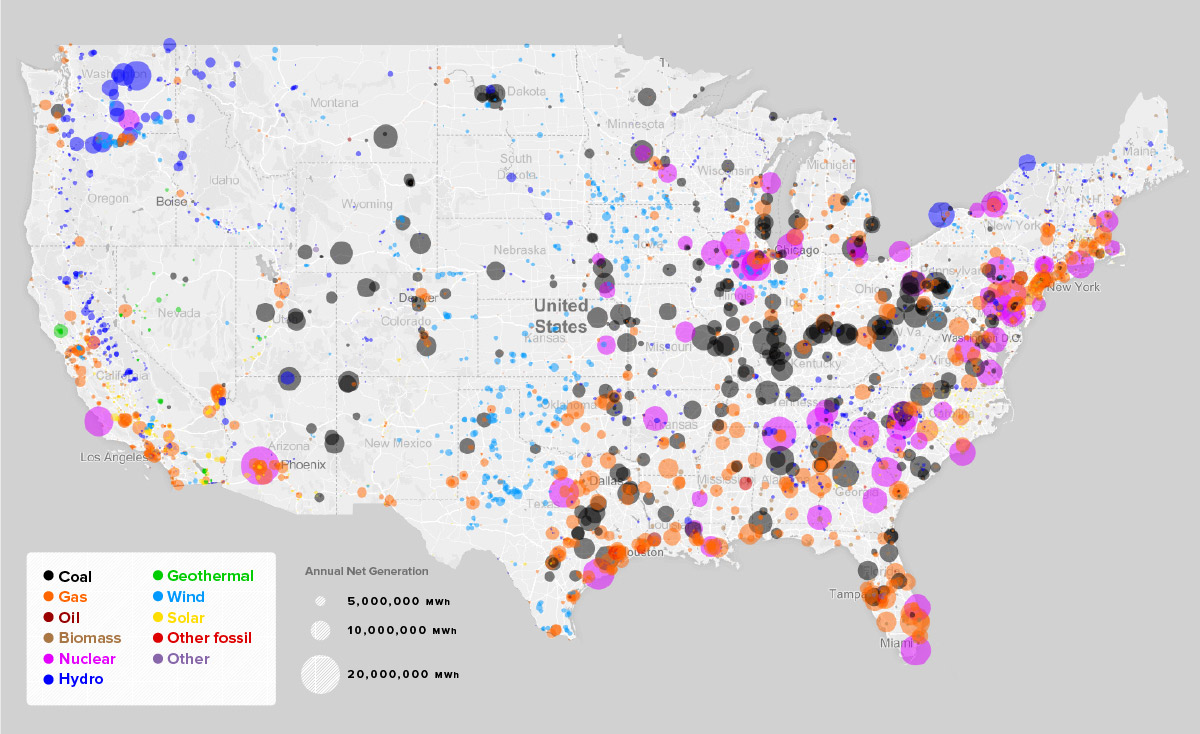
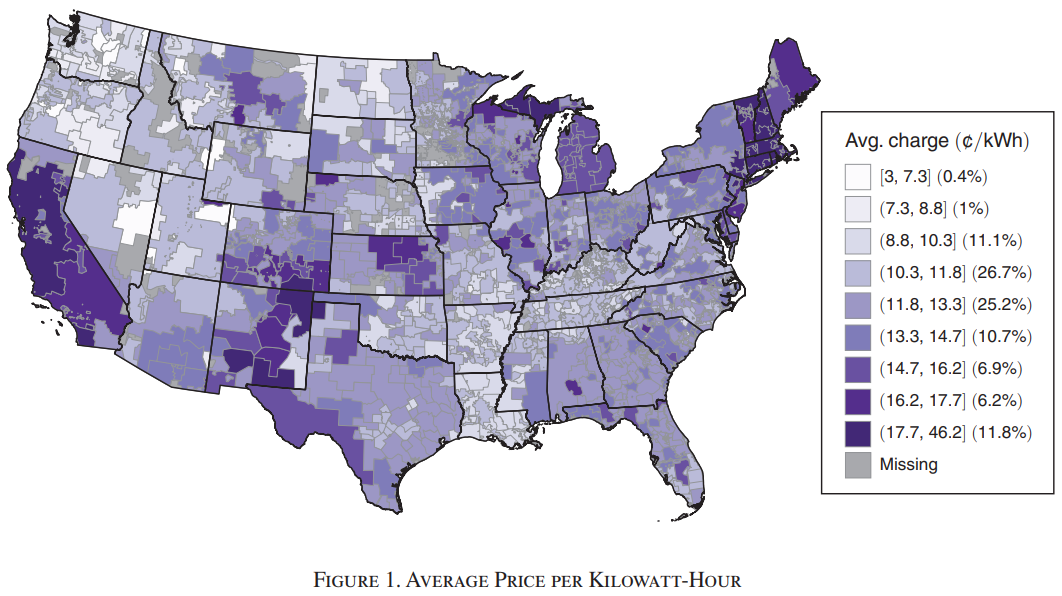
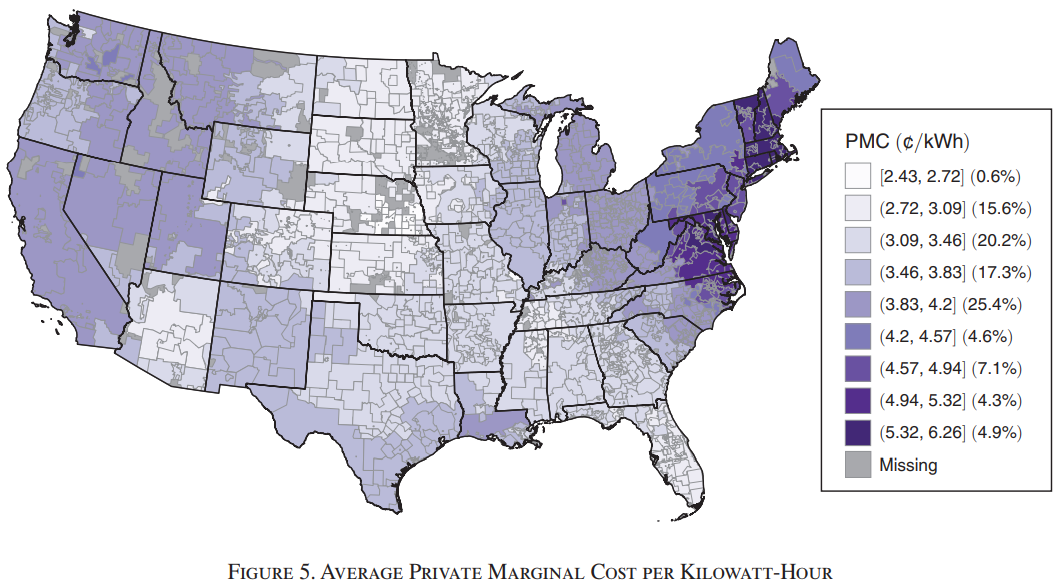
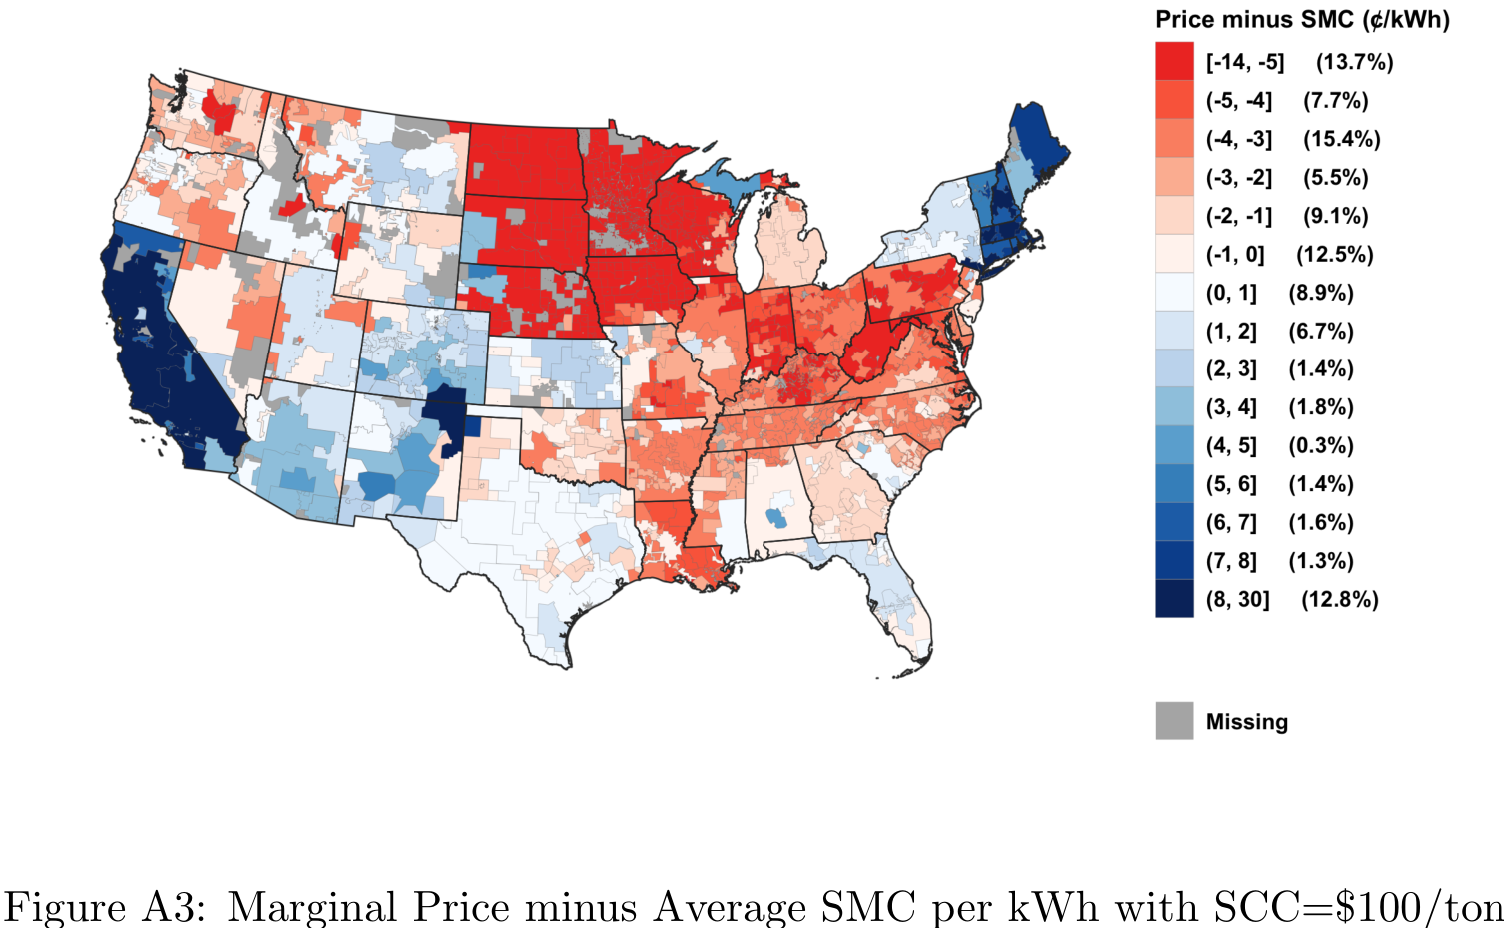
- These factors explain the patterns in following map.
- They also reflect policy options
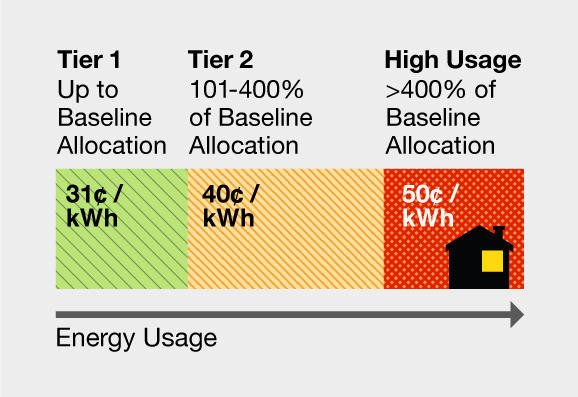
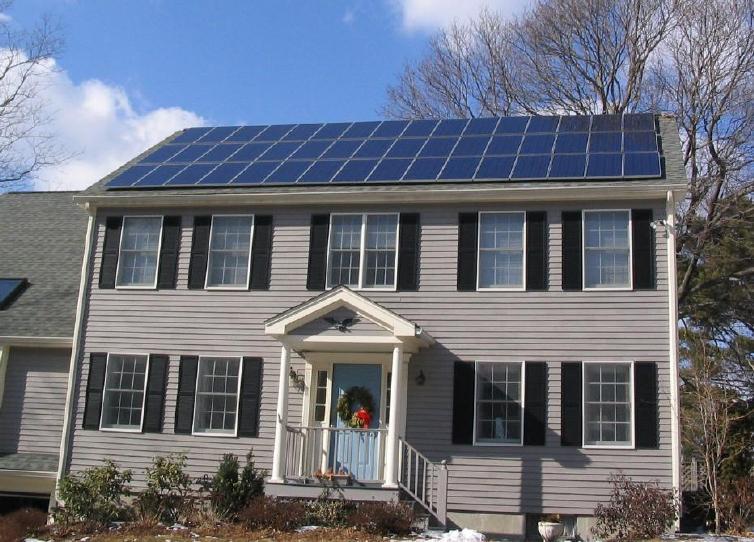
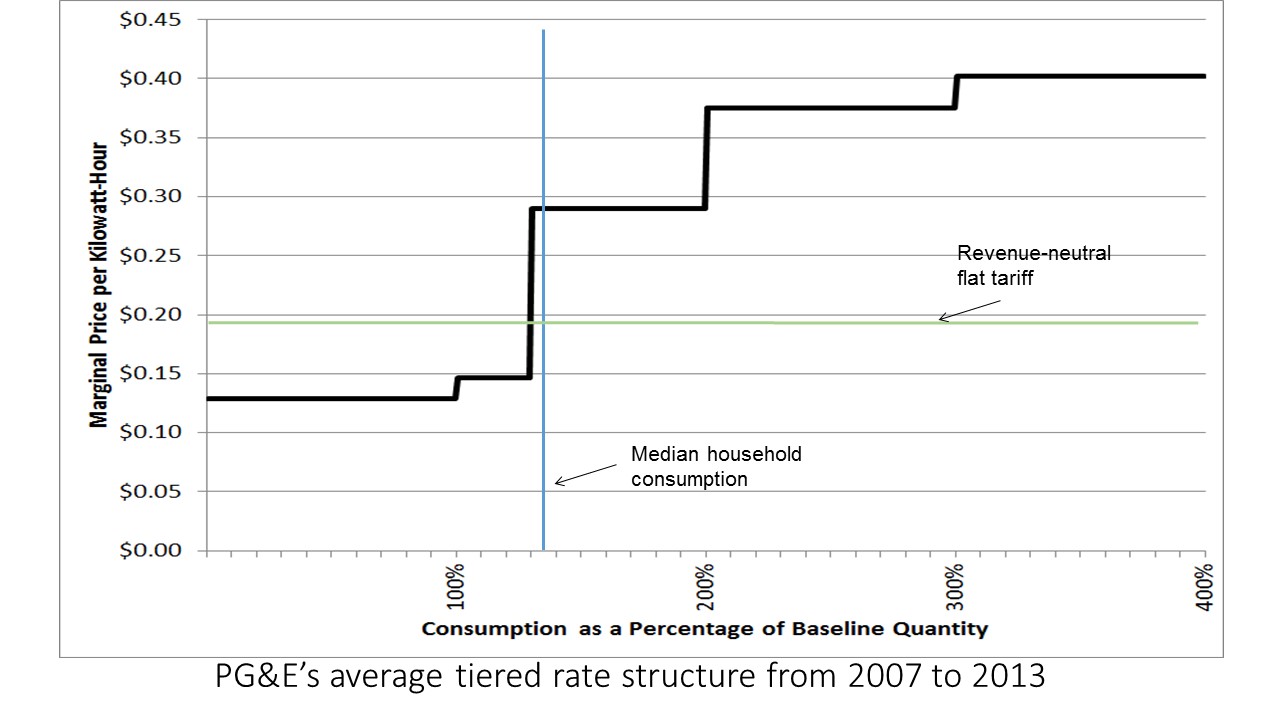
What put California at the top of residential solar?
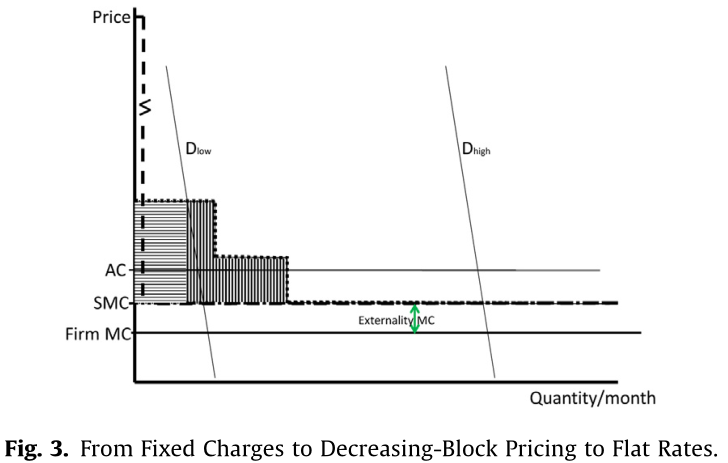
CA has increasing block pricing
Goal: Recover fixed costs equitably.
Result: Large consumers size system to get on low tier.
![]()
Source: Severin Borenstein
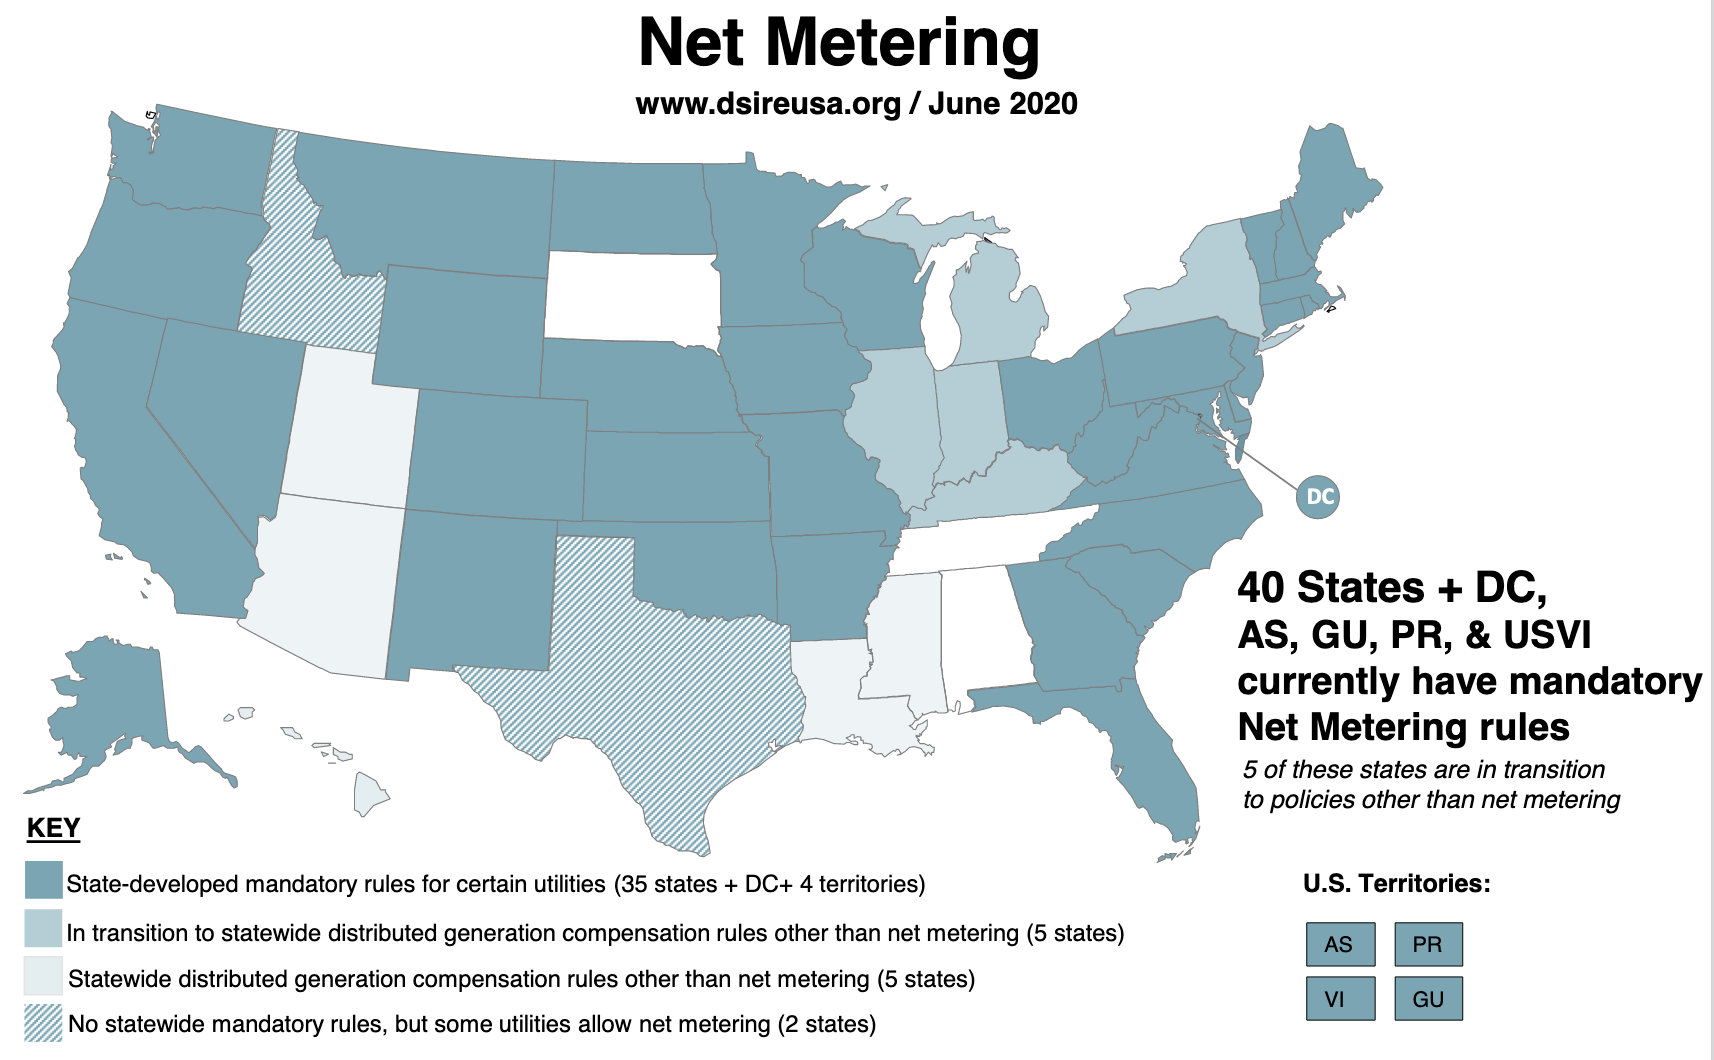
What if you produce more than you consume?
Common policy: net energy metering (NEM)
- NEM allows PV owners to sell power back to the grid
- This breaks the temporal cap on solar (\(s_{h}<e_{h}\))
- Most places in the US still require \(\sum_{h}s_{h}<\sum_{h}e_{h}\)
44 states currently allow net metering
![]()
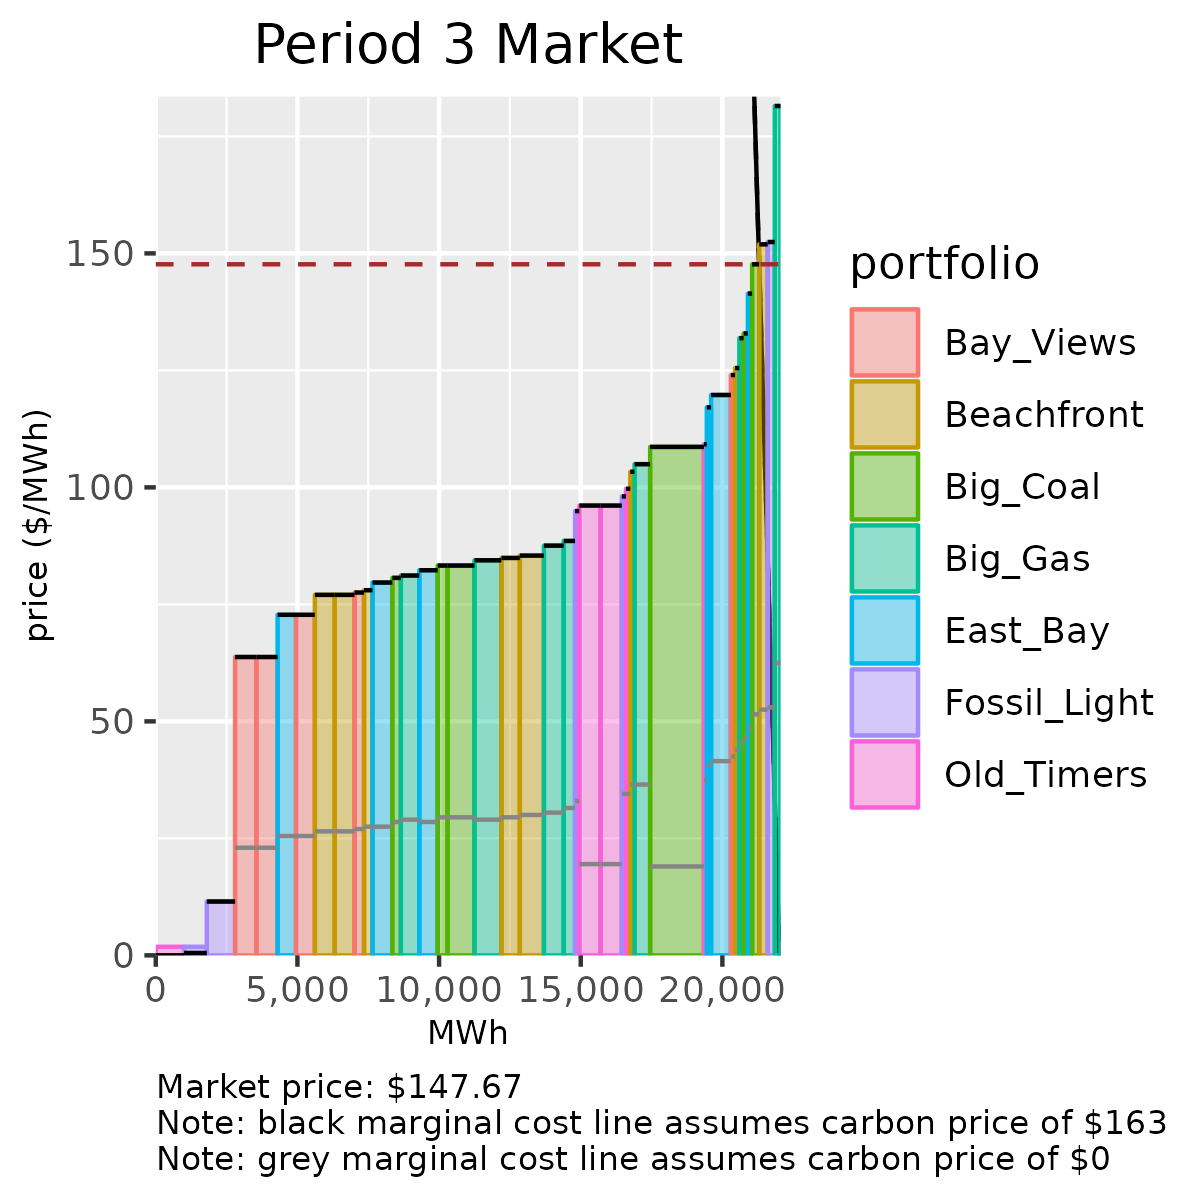
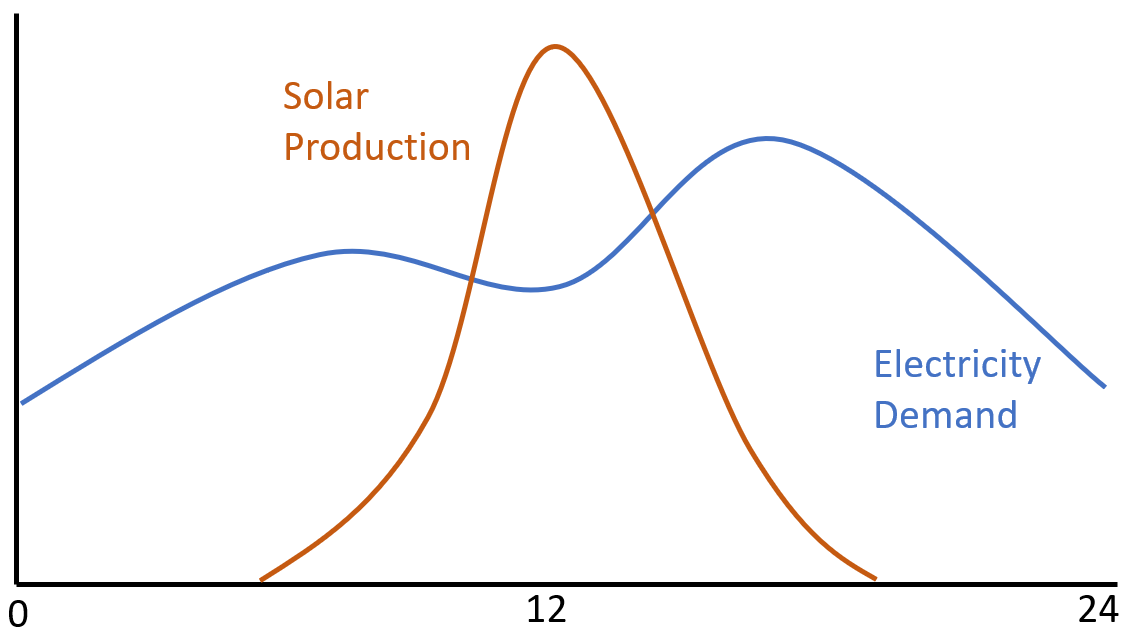
Solar production and consumption generally not aligned
![]()
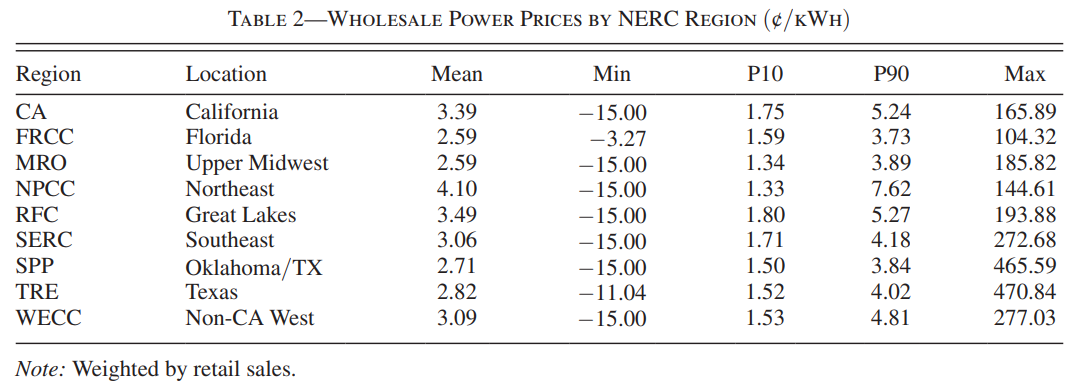
Wholesale cost avoided varies over time
![]()
In CA we often have too much solar mid-day
- The price in these periods can actually be negative!
![]()
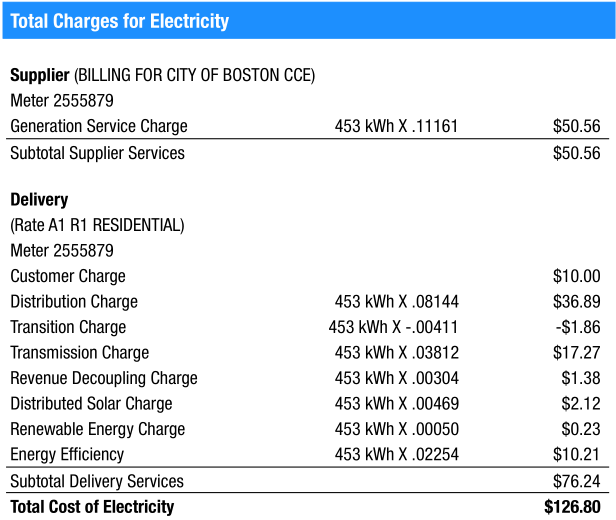
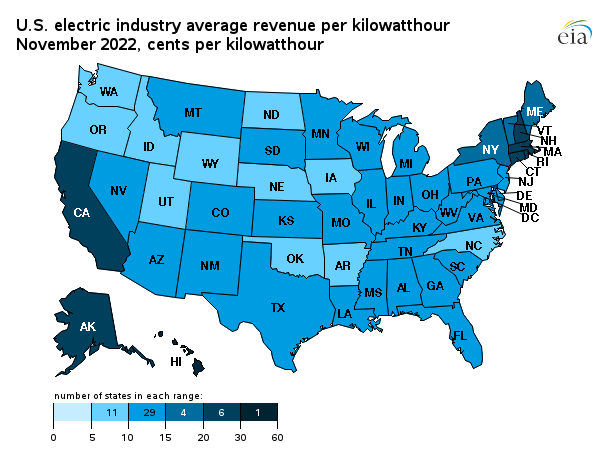
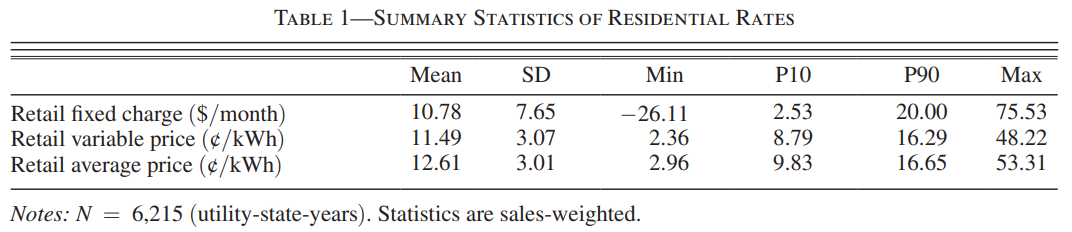
The price on your bill includes fixed costs
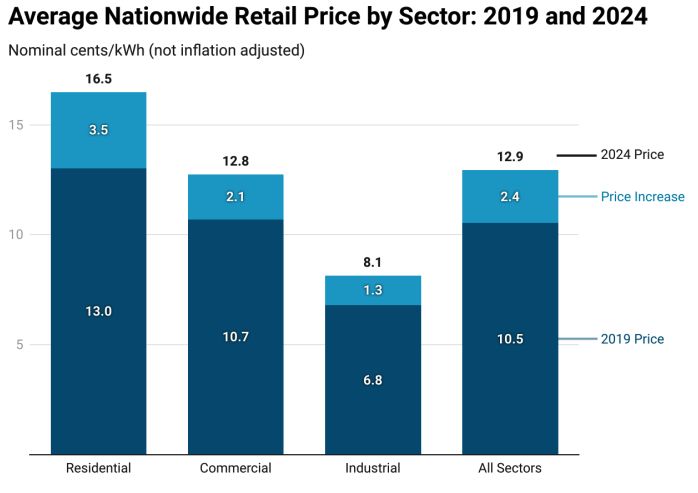
- I paid $0.217/kWh, but only half of that was for generation.
- Fixed charges \(\approx\) total system cost independent of quantity consumed, divided by anticipated sales.
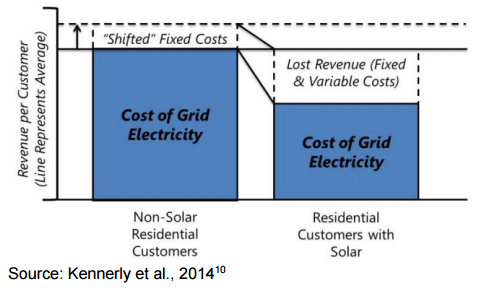
Major problem
As PV owners buy less electricity, the burden of those fixed costs will be shifted onto other households
- That increase in prices will incentivize even more households to install PV…..
- This is the utility “death spiral”
One solution is to charge consumers a large fixed cost just for being connected to the grid
- What do people think about this?
So what’s the answer?
How should we compensate / encourage solar PV?
- efficient solution would
- charge a fixed fee for everyone that uses (or may use) the grid
- incentivize people to reduce consumption at times when it is more valuable
- but that value is the wholesale price
- pricing externalities makes subsidizing solar irrelevant
Summary on Solar
- Solar value proposition closely related to subsidies, sun, and the price you pay for electricity.
- Subsidies have been generous, not obviously correlated with social value, and very volatile.
- Letting people sell back to the grid makes sense, but at what price?
- When large parts of the population install solar, we need to rethink how we cover the fixed costs of a reliable power system.