GIS Example My Research


Prof. Richard L. Sweeney

May 1, 2019

Much of my recent research on fracking boom

Lots of interesting economic and policy questions

Most have a spatial component

  • what are the costs of this technology?

    • health impacts, house prices
  • how did firms learn where the good formations were and how to drill them efficiently?

  • who benefited?

    • new formations worth approx $4 trillion
    • 75% of that technically owned by private individuals, farmers, ranchers

"Relinquishing Riches: Auctions vs 'Wild West' Negotiations in Texas Oil and Gas Leasing"

with Thom Covert (link)

How should you lease your land?

  • Individuals own the minerals, but to monetize need to partner with an oil company.

  • These companies much more informed about value.

  • Economic theory suggests using an auction, but in practice most people "negotiate"

  • We estimate how much money negotiations leave on the table using a "natural experiment" in Texas

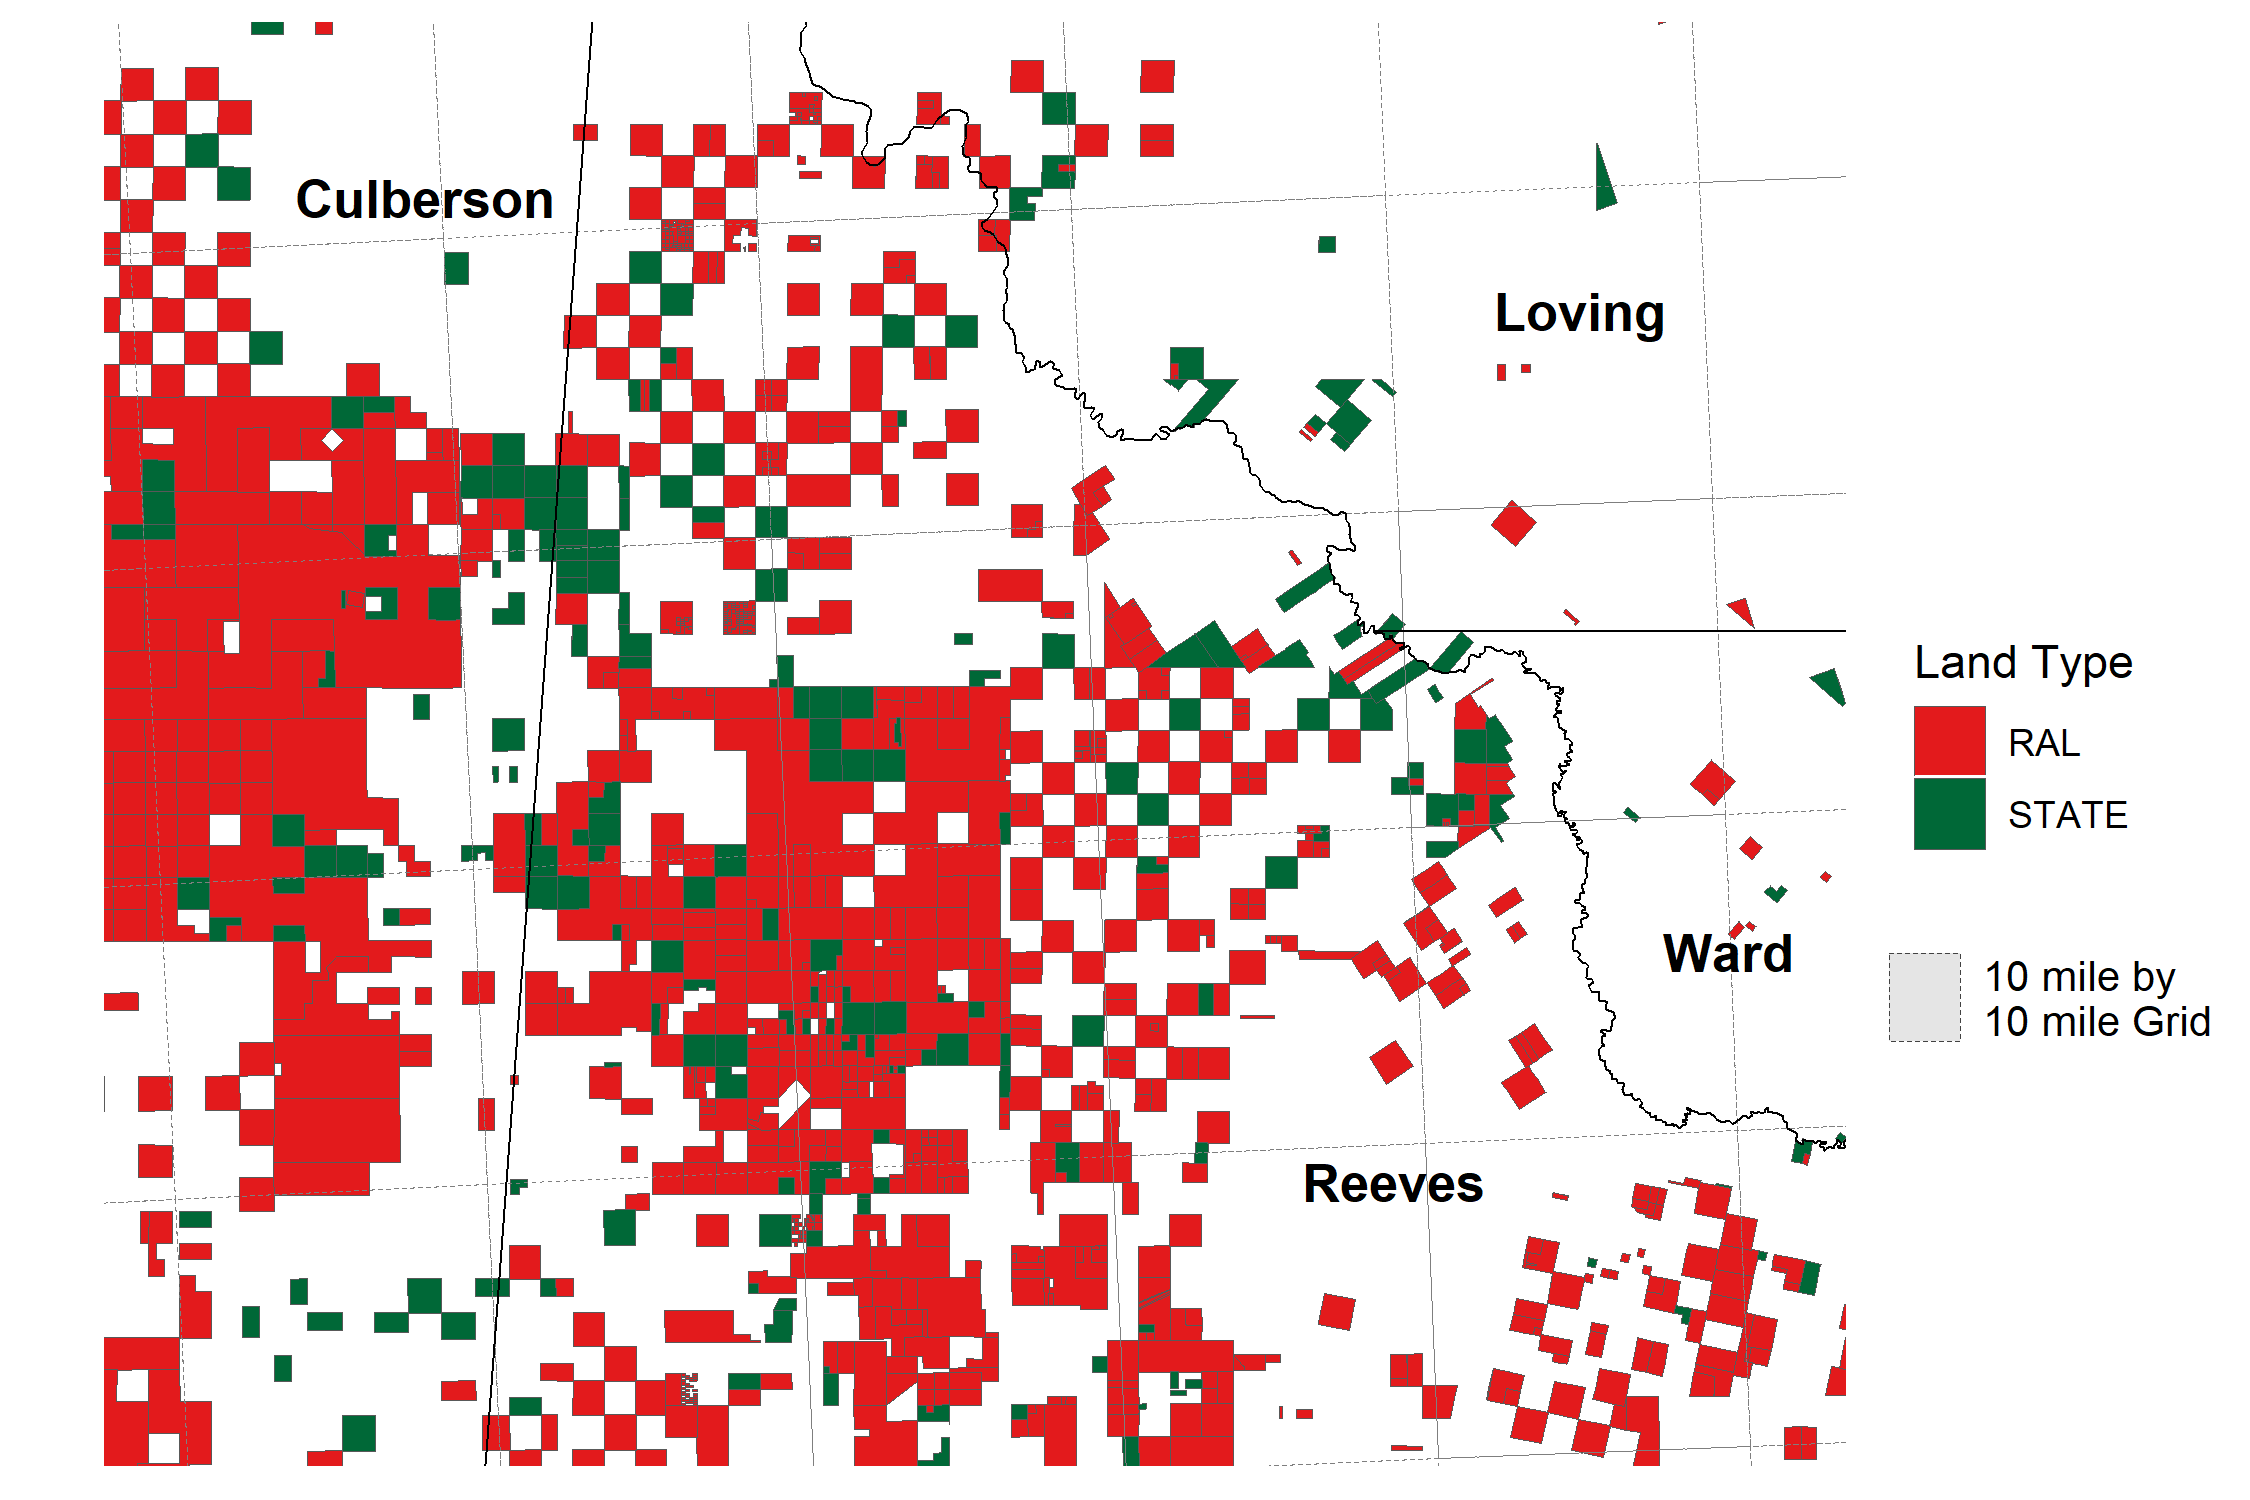
Texas constitution set aside land for public use

title_img_2row

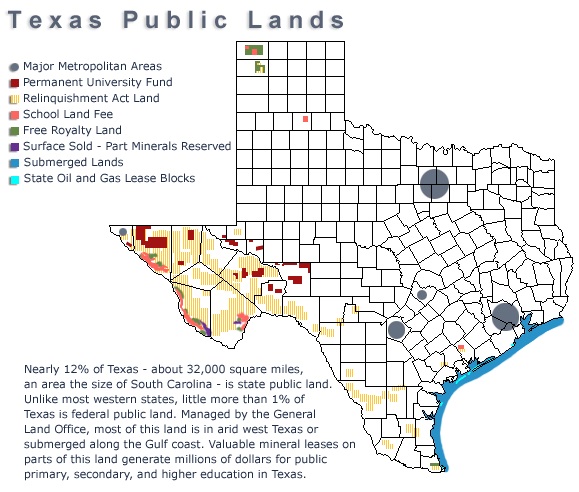
Public school lands sold prior to 1919 negotiated.
Rest auctioned centrally.

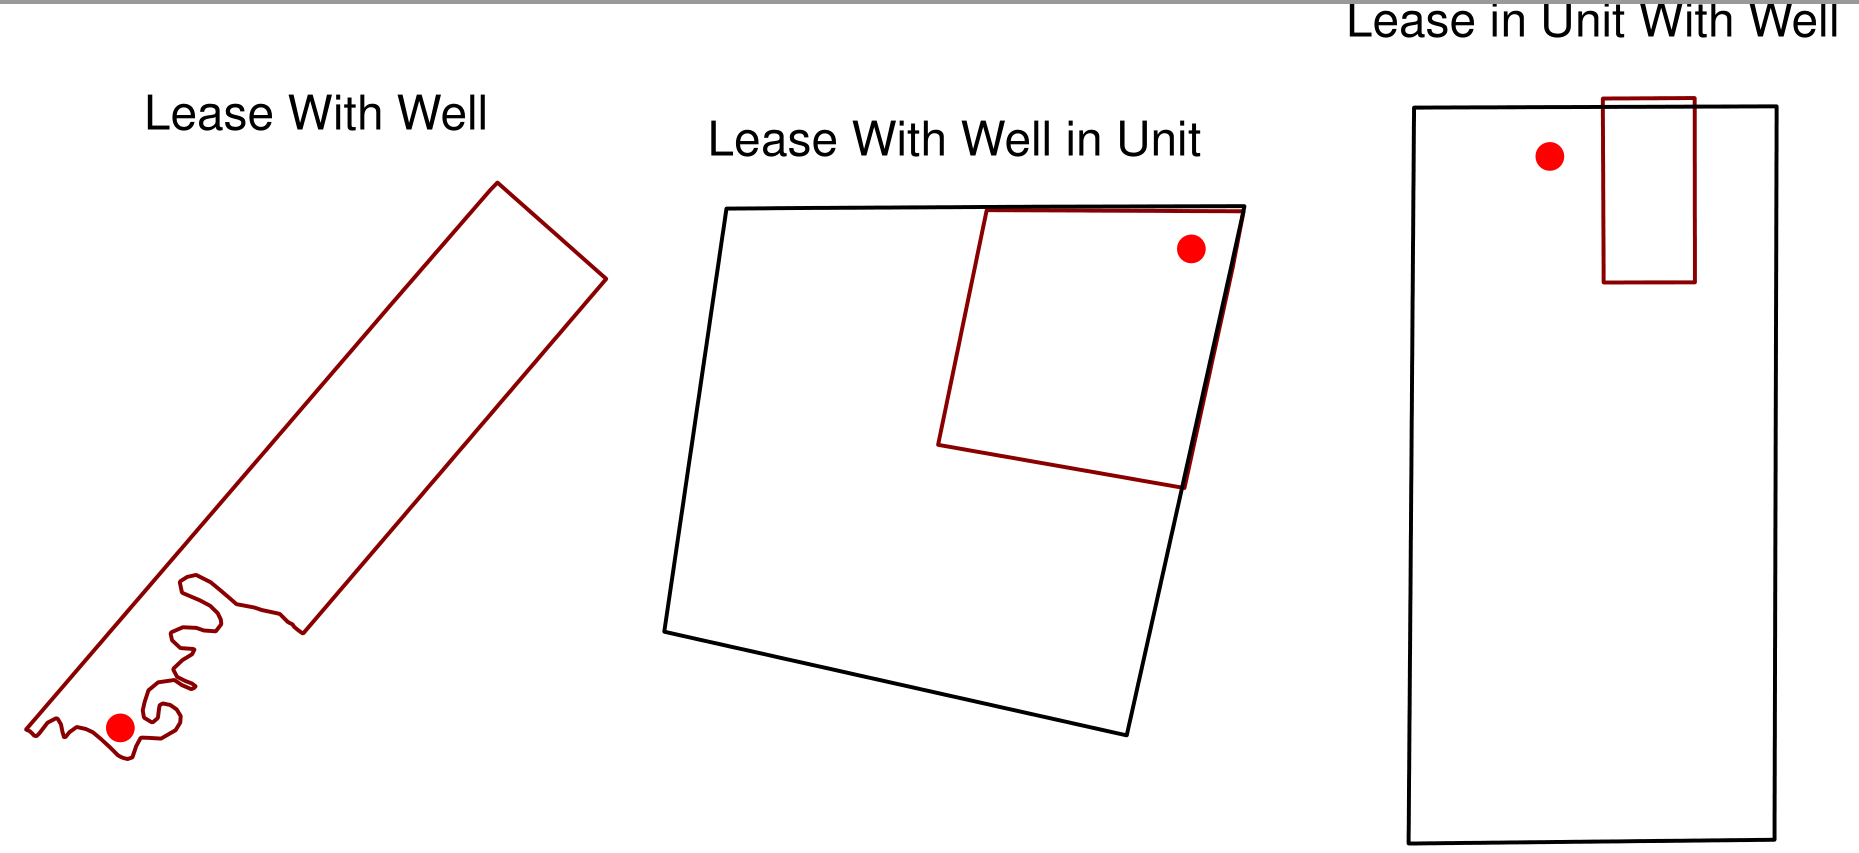
We map these parcels to subsequent leases

title_img_2row

Also used machine learning to group leases

And map leases to well production

Challenge: finding reasonable buffers/ rules for trading off between Type I and Type II errors

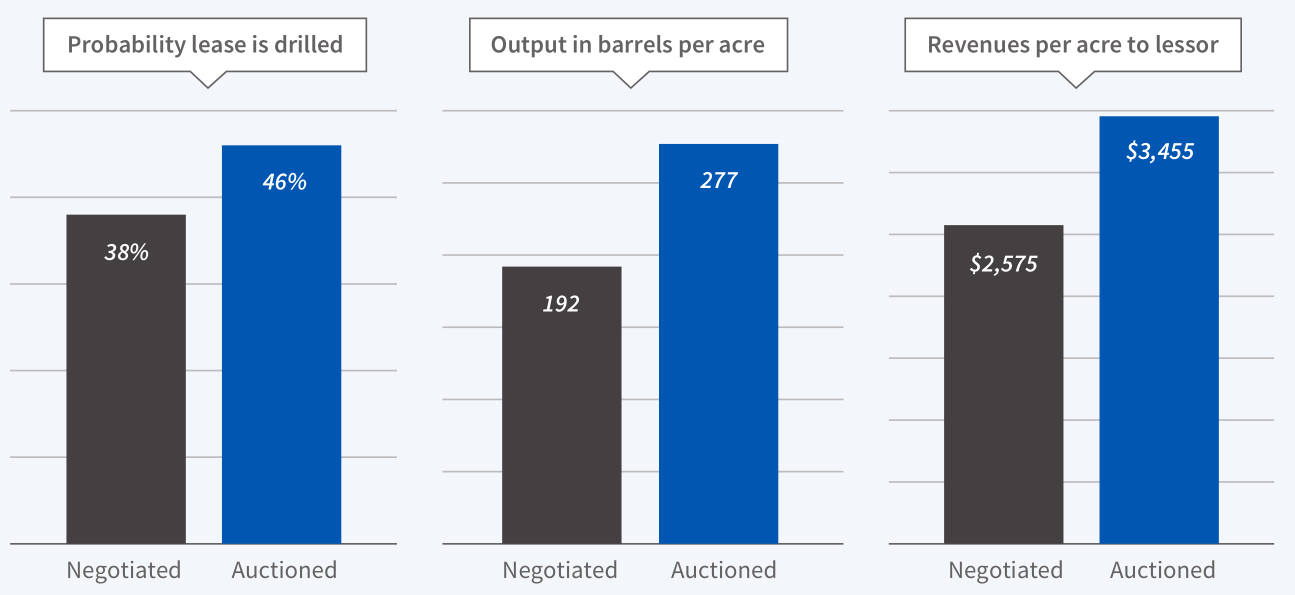
Bonuses > 50% higher at auction

title_img_2row

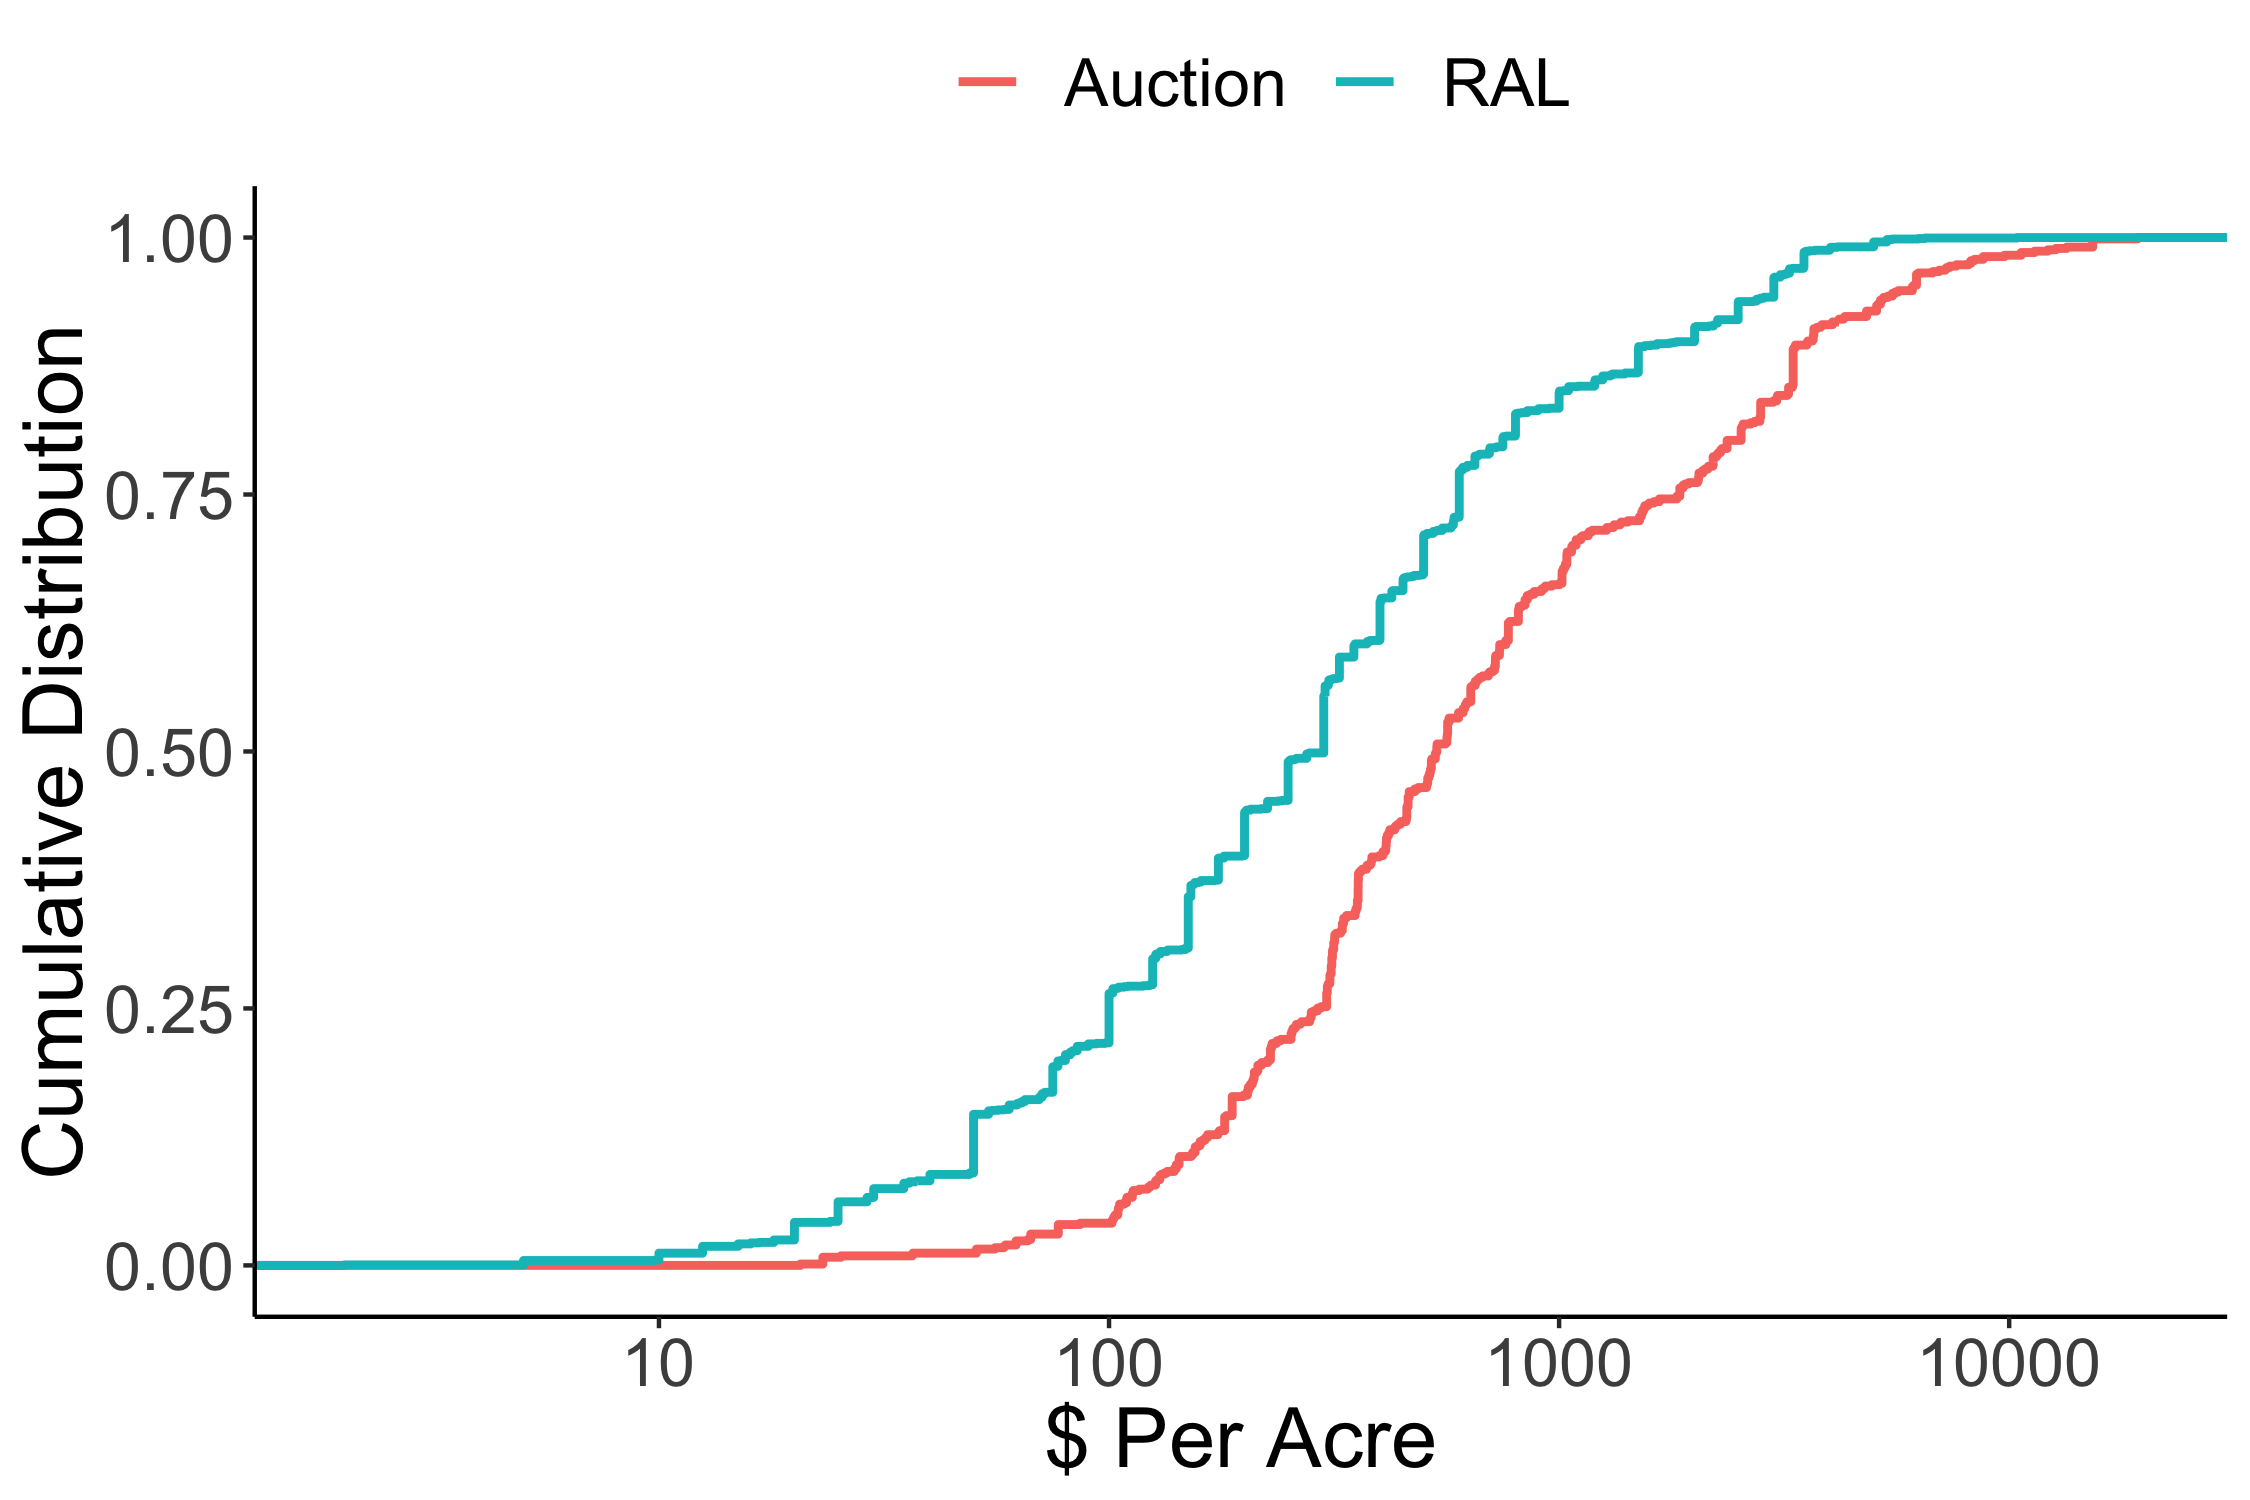
For typical lease, this is approx $200K

Land also more productive

title_img_2row

Some GIS lessons

  • Used both ArcGIS and R

    • we have a full time pre-doc (at Chicago)
  • Curse of dimensionality in spatial data

    • 100,000 leases x 40,000 wells
    • want continuous measure of controls TBD
    • full DF with distance to every well is 4 billion rows
  • Putting wells in 10K leases takes a day on server